Skip to content




You’re getting steady traffic, your ad dashboards look active, and your team keeps asking for more budget. Yet sales remain stubbornly flat. Visitors arrive from Google Ads, Meta, search results, and email, then disappear somewhere between the landing page, product page, form, or checkout.
That gap is where conversion rate optimization, or CRO, earns its place. It isn’t a synonym for redesigning a landing page, changing a button color, or copying a competitor’s layout. CRO is a disciplined way to help more of the visitors you already attract complete valuable actions, while improving the wider revenue system around those actions.
Why Conversion Rate Optimization Matters for Revenue
A mid-sized ecommerce brand may attract steady visitors from Google Ads, Meta, search, and email while revenue remains difficult to grow. Media costs rise, purchase intent varies, and the share of visitors reaching checkout stays flat. The dashboard can show stable sales even as contribution margin narrows.
Conversion rate optimization, or CRO, improves the return from that existing visitor flow. A clearer product explanation can resolve hesitation. Stronger reassurance near checkout can address risk. A faster page or shorter path to payment can help more qualified visitors finish what they started.
Consider a brand whose conversion rate rises from 2.1% to 3.6%. That is a 1.5 percentage-point lift. The example explains the mechanism without promising a universal outcome: with the same visitor flow, the higher rate produces more customers from acquisition activity already in place. The business still has to protect product margins, fulfillment economics, and customer experience, but each acquired visitor becomes more productive.
The effect reaches beyond paid campaigns:
- Paid traffic efficiency: More completed purchases can improve the economics of Google Ads and Meta campaigns when other inputs remain stable.
- Organic landing-page quality: Search visitors find pages that answer objections and make the next action easier to understand.
- Email re-engagement: Abandoned-cart and browse-recovery messages can send people into a clearer, less frustrating path.
- Retention micro-conversions: A useful post-purchase experience can encourage account creation, product education, reviews, or a second purchase.
” Practical rule: Before increasing acquisition spend, check whether your funnel is converting the traffic it already receives.
This matters especially when acquisition costs are climbing. A budget increase buys more opportunities, while CRO improves the multiplier applied to opportunities from paid and organic sources. Small improvements can also support retention, because a better first purchase and post-purchase experience give customers more reasons to return.
CRO produces reusable learning as well. A checkout insight may change email content, product messaging, customer support guidance, and future landing pages. One experiment can therefore improve several connected parts of the revenue system rather than a single page.
The history of conversion rate optimization reflects the move toward structured experimentation. Earlier split testing and website experimentation became widely accessible in the mid-2000s, Google launched Google Website Optimizer in 2006, and Microsoft’s CUPED method in 2013 improved experiment precision by reducing variance. CRO has developed from informal page tweaking into a more rigorous way to make growth decisions.
The Core Definition of CRO and How It Works
A visitor arrives from a paid ad, reads a product page, adds an item to the cart, and leaves before payment. Another visitor reaches the same page and completes the purchase. CRO examines the difference between those paths, then improves the experience so more suitable visitors progress toward a business outcome.
Conversion rate optimization is the systematic practice of increasing the percentage of visitors who complete a desired action. That action varies by business. For an online retailer, it may be a purchase. For a consultancy, it may be a qualified inquiry. For a software company, it could be a trial signup or a request for a demonstration.
The basic formula is straightforward:
Conversion rate = conversions ÷ total visitors
A storefront with 100 visitors and three purchases converts at 3%. A website follows the same logic. The store analogy also clarifies CRO’s role in the wider revenue system. Traffic creates opportunities, while CRO helps a greater share of those opportunities become purchases, leads, signups, or other valuable steps.
Start with the funnel question
A practical CRO program follows a connected sequence:
- Research the funnel. Review analytics, customer feedback, support conversations, form behavior, recordings, and page performance. Locate hesitation and drop-off.
- Write a hypothesis. State what may be happening, why it matters, and which change could address it.
- Prioritize the opportunity. Weigh traffic, business value, evidence strength, and implementation effort.
- Run an experiment. Compare a control with a variant, or apply another suitable research method.
- Measure the chosen outcome. Track the primary conversion alongside relevant supporting actions.
- Ship or revise. Implement a credible winner, reject an unsupported idea, or use the learning to form the next hypothesis.
A macro-conversion is the main business outcome, such as a purchase, signup, booking, or qualified lead. Micro-conversions are smaller actions that show progress, including an add-to-cart click, a completed form step, a product video view, or meaningful engagement with onboarding.
Micro-conversions should support revenue metrics, not replace them. They show where momentum builds or breaks. Someone who adds a product to a cart but does not purchase presents a different problem from someone who never reaches the product page.
CRO can improve the efficiency of paid and organic traffic, raise the value captured from each visit, and support retention through a better customer journey. A small lift at several stages, from landing-page engagement to checkout completion and post-purchase actions, can improve the full revenue system. That is why CRO belongs alongside acquisition, merchandising, lifecycle marketing, and retention.
The Experimentation Mindset Behind Every CRO Program
Without a testing framework, CRO becomes a queue of opinions rather than a system of evidence. A senior executive may prefer a new headline, a designer may favor a cleaner layout, and a marketer may want a brighter call to action. Each view can contribute a useful question, but controlled evidence shows which change helps this audience in this context.
A controlled experiment converts that question into a testable claim. The independent variable is what the team changes, such as headline wording or form structure. The dependent variable is the outcome it measures, such as completed purchases or qualified submissions. The control preserves the current experience, while the variant applies the proposed change.
Turn ideas into documented bets
A useful hypothesis connects four parts:
- Observation: Visitors abandon a step or fail to understand an offer.
- Proposed cause: The page leaves an objection unanswered or creates unnecessary effort.
- Change: The team adds specific reassurance, clarifies the value proposition, or removes a step.
- Success definition: The primary conversion improves without harming important downstream behavior.
Random assignment gives visitors a fair chance of entering the control or variant, reducing selection bias. Before launch, define the minimum detectable effect, the smallest improvement worth detecting. Otherwise, early results can encourage teams to change the standard until the outcome looks favorable.
Sample size limits what an experiment can establish. At a 5% baseline conversion rate, detecting a 10% relative lift can require about 7,700 to 20,000 users per variant, depending on assumptions. A 5% relative lift can require roughly 125,000 visitors per variation at 95% confidence and 80% power, according to this A/B test sample-size reference. Low traffic does not prevent learning, but it may require broader changes, longer observation, or research methods other than a narrowly targeted test.
A losing or inconclusive test still creates value when the team records the audience, exposure, hypothesis, result, and interpretation. That record helps product, paid media, lifecycle, and web teams reuse evidence across the revenue system. It also connects small improvements in traffic efficiency, checkout progress, and retention instead of treating each page as an isolated project.
Teams seeking a practical example can review this case study on testing before redesigning. Its principle applies beyond one page: validate the problem and proposed solution before committing substantial design and development effort.
Common CRO Test Types and When to Use Them
The best test type depends on the business question, the size and quality of the audience, and how much change the team wants to introduce. A/B testing is usually the clearest starting point because it compares two experiences directly. A team might test a product-page message, a checkout layout, or a lead-form introduction against the current version.
Multivariate testing changes several elements and evaluates combinations. It can help on a stable, frequently visited template where the team wants to understand interactions between a headline, image, and call to action. The tradeoff is analytical complexity and greater traffic demand, so it isn’t a sensible default for every site.
Split URL testing suits a substantial redesign when the new experience has a separate URL or architecture. It answers a broad question, such as whether the existing page structure or a different journey better supports the goal. Sequential testing fits flows where users move through an ordered experience, including pricing exploration or onboarding, though teams must define the sequence carefully to avoid confusing exposure effects with genuine improvement.
Match the method to the decision
| Test Type | Best For | Traffic Required | Typical Use Case |
|---|---|---|---|
| A/B test | Head-to-head page or element comparisons | Moderate to high, depending on the effect being measured | Product-page headline, CTA, form treatment, or checkout message |
| Multivariate test | Interactions among several page elements | Higher than a focused A/B test | Evaluating combinations within a stable template |
| Split URL test | Large structural or design changes | Sufficient traffic across separate experiences | Comparing an existing page with a full redesign |
| Sequential test | Ordered journeys and multi-step experiences | Depends on flow length and outcome | Pricing exploration or onboarding progression |
| Micro-conversion test | Early or supporting actions | Depends on action frequency and business relevance | Add-to-cart, newsletter signup, or video completion |
| Qualitative study | Discovering friction and generating hypotheses | No fixed statistical threshold | Session recordings, usability sessions, support-ticket analysis |
Micro-conversions are valuable when the macro-conversion is rare or delayed, but they should remain connected to commercial outcomes. A higher video-completion rate matters more when viewers later request information, add a product, or progress through the funnel. The landing-page design guidance from Excellorix can help teams identify page elements worth investigating, but the audience’s behavior should decide which idea earns a test.
A simple decision rule works well. Use an A/B test for a focused, high-confidence change. Use a split URL test for a structural change. Use multivariate testing only when the page has enough traffic and the interaction question justifies the complexity. Use qualitative research before any of these when the team doesn’t yet understand the friction.
How to Measure Lift, Statistical Confidence, and Test Duration
A checkout variant can look successful because it gains more purchases, or because a small early action rises while completed orders fall. Measurement must connect each result to the revenue system, from paid and organic traffic efficiency to retention and micro-conversions.
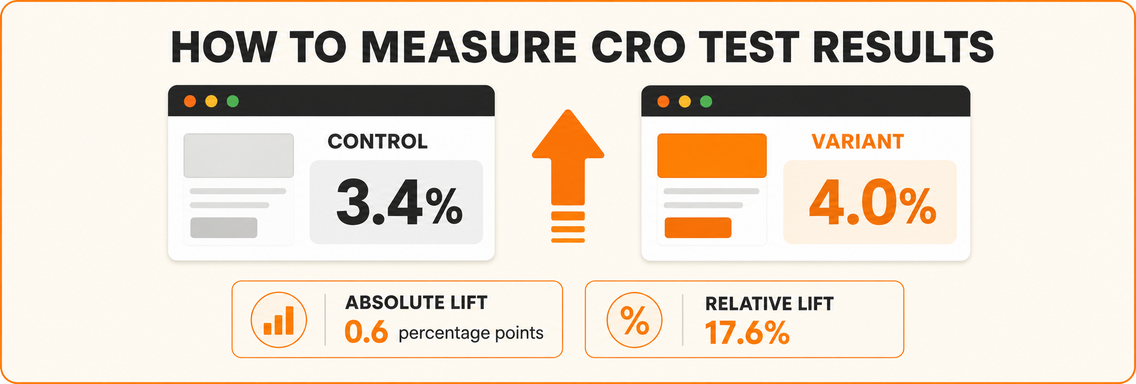
Start with two conversion rates. Absolute lift is the difference between the variant and control in percentage points. Relative lift compares that difference with the control rate. For example, if a control converts at 3.4% and a variant converts at 4.0%, the absolute lift is 0.6 percentage points. The relative lift is (4.0, 3.4) ÷ 3.4, or approximately 17.6%. Absolute lift describes the size of the rate change. Relative lift shows how large that change is compared with the starting point.
Understand what confidence does and doesn’t mean
A p-value helps quantify how compatible the observed result is with a no-difference assumption. A confidence interval gives a range of plausible values for the underlying effect. Teams often use a 95% confidence threshold, yet statistical significance does not prove that a change will keep winning, work for every segment, or improve profit after release.
Statistical power describes a test’s ability to detect an effect that exists. The minimum detectable effect defines the improvement the test is designed to identify. A low baseline rate or small expected effect can require a much larger sample, so calculate sample size before launch with an appropriate planning method.
Stopping when the dashboard briefly favors the variant creates peeking bias. Every extra check gives random fluctuation another opportunity to resemble a win. Set a planned duration, or use a method designed for sequential decisions, then judge the result against the rule agreed before launch.
Record the hypothesis, audience, primary metric, guardrails, planned sample, duration, result, confidence interval, and decision. This record links a local lift to the wider funnel. If a variant increases a signup but reduces purchase completion or later retention, the team can avoid shipping a misleading improvement.
” Measurement discipline: Decide what counts as meaningful before visitors enter the test. Otherwise, the result can start changing the rules.
Page performance also belongs in the diagnosis. An industry analysis reports that pages loading in 1 second can convert about 3 times better than 5-second pages and about 5 times better than 10-second pages, with conversion rates declining as load time increases, according to this analysis of load time and conversion behavior. A slower experience can affect every downstream action, so a conversion result may reflect speed as well as the tested idea.
For a plain-language review, consult these examples of misleading statistics. Better measurement does not guarantee a positive test. It makes the resulting revenue decision more trustworthy.
Common Mistakes and Misconceptions That Undermine CRO
The most damaging CRO mistake is treating it as a landing-page styling exercise. A visitor can understand the landing page and still abandon the product page, fail to complete a form, lose patience during checkout, or ignore the post-purchase path. The optimization perimeter should follow the customer journey, not the boundaries of the web team’s backlog.
Audit the program, not just the page
Several habits weaken otherwise capable teams:
- Testing with insufficient traffic: A small audience can produce unstable results, especially when the expected improvement is modest. Choose a question the available audience can answer.
- Changing too many things without a tagging plan: If the headline, offer, layout, and checkout change together, the team may observe movement without knowing what caused it.
- Calling an inconclusive result a winner: A favorable direction isn’t the same as reliable evidence. Keep the test classified as inconclusive when it doesn’t meet the agreed decision rule.
- Chasing vanity metrics: Time on page, scroll depth, or clicks can help diagnose behavior, but they shouldn’t outrank purchases, qualified leads, retention, or revenue-linked progression.
- Treating personalization as a shortcut: A personalized experience is still a hypothesis. Segment it, define the expected behavior, and test whether it improves the business outcome.
- Running CRO as a one-off project: A single redesign may remove visible friction, but it won’t keep pace with new traffic sources, products, devices, objections, and customer expectations.
Qualitative evidence deserves a place beside analytics. Support tickets, reviews, sales-call notes, and usability observations can reveal confusion that a funnel report only shows as abandonment. Those sources don’t replace controlled measurement. They help the team choose better experiments.
A broader view is becoming more important because recent 2025 coverage describes CRO moving from page-by-page changes toward full customer-journey optimization, including micro-conversions, omnichannel journeys, and post-purchase actions, as discussed in this overview of CRO trends. The implication is practical: teams should ask which actions predict revenue, not only which page gets the final click.
Use a short guardrail checklist before launch:
- Is the primary business outcome clearly defined?
- Is the audience assigned fairly?
- Is the sample and duration plan documented?
- Are guardrail metrics included?
- Can analytics distinguish control from variant?
- Will the team record an inconclusive result accurately?
Putting It All Together and Building a CRO Habit
CRO becomes durable when it fits the team’s operating rhythm. It shouldn’t depend on a dramatic redesign or a quarterly burst of enthusiasm. A simple weekly practice can keep the work connected to revenue:
- Pick one funnel: Choose a product journey, lead path, checkout step, onboarding flow, or retention action.
- Find the strongest evidence: Combine funnel analytics with customer language, support tickets, recordings, and page-performance observations.
- Write one hypothesis: Identify the friction, propose a change, and name the primary outcome.
- Choose one experiment: Match the method to the question, available traffic, expected effect, and implementation effort.
- Set the measurement rule: Define lift, confidence, duration, sample expectations, and guardrails before launch.
- Review and document: Ship a credible winner, reject the idea, or record the learning as the input for the next test.
The challenge is to stop treating traffic growth as the only path to revenue growth. Paid search and Meta can bring more visitors, SEO can expand discovery, and email can return people to the site. If the experience continues losing the same visitors at the same step, each channel sends more opportunity into the same leak.
CRO compounds across the system. A clearer organic landing page can improve the first visit, a better product page can support paid traffic, a smoother checkout can turn more carts into orders, and a useful post-purchase flow can encourage deeper engagement. The effect of any individual experiment will vary, but the habit creates a steady stream of evidence about what your customers need.
Start this week by identifying the lowest-converting step in one important funnel. Write down the evidence that makes it a priority, choose one change that addresses the likely friction, and commit to a measurement plan before you launch it. The competitive edge isn’t a single winning variation. It’s the team’s ability to learn, apply, and test again without losing sight of revenue.
Excellorix helps organizations connect website design, paid media, SEO, analytics, and conversion optimization into a revenue-focused growth system. Visit Excellorix to explore funnel audits, landing-page optimization, A/B testing, and measurement support for turning more qualified traffic into customers.