 Skip to content


Google Ads Quality Score is a 1–10 keyword-level diagnostic based on expected clickthrough rate, ad relevance, and landing page experience. It isn’t an auction input, and it shouldn’t be treated as a live KPI or a complete measure of account performance.
The popular advice to “raise every score” points advertisers toward the wrong target. A low number can identify a weak ad, mismatched intent, or poor landing page, but the number itself doesn’t tell you what to change. Senior media buyers use Google Ads Quality Score as a troubleshooting signal, then validate the diagnosis against spend, search terms, conversions, and auction performance.
Table of Contents
- Why Quality Score Is Not What You Think It Is
- The Three Ranking Signals Behind the Score
- How to Improve Expected Clickthrough Rate
- Optimizing Ad Relevance and Landing Page Experience
- Diagnostic Score Versus Auction-Time Quality
- Prioritizing Fixes Across Large Keyword Sets
Why Quality Score Is Not What You Think It Is
Sorting a keyword report by the lowest Quality Score looks efficient. It can produce the wrong work queue. A low-volume keyword with a weak score may deserve less attention than a higher-spend keyword with a slightly stronger score but a landing page that loses conversions. Prioritize commercial impact and diagnose the weak component before assigning work.
Google introduced Quality Score in July 2005 as part of its auction system. By 2008, it had added landing page quality and load time as factors and changed the calculation so it could be evaluated around each search query rather than remain a static per-keyword value. Google’s current documentation presents the visible score as a 1–10 keyword-level diagnostic, with components labeled above average, average, or below average (Google’s Quality Score documentation).
That history explains why the metric is easy to misread. The report shows a diagnostic associated with a keyword, while auction-time ad quality is assessed in the context of an individual search and auction. The visible score helps identify where to investigate. It is not a live auction control that Google directly integrates into every bid calculation.
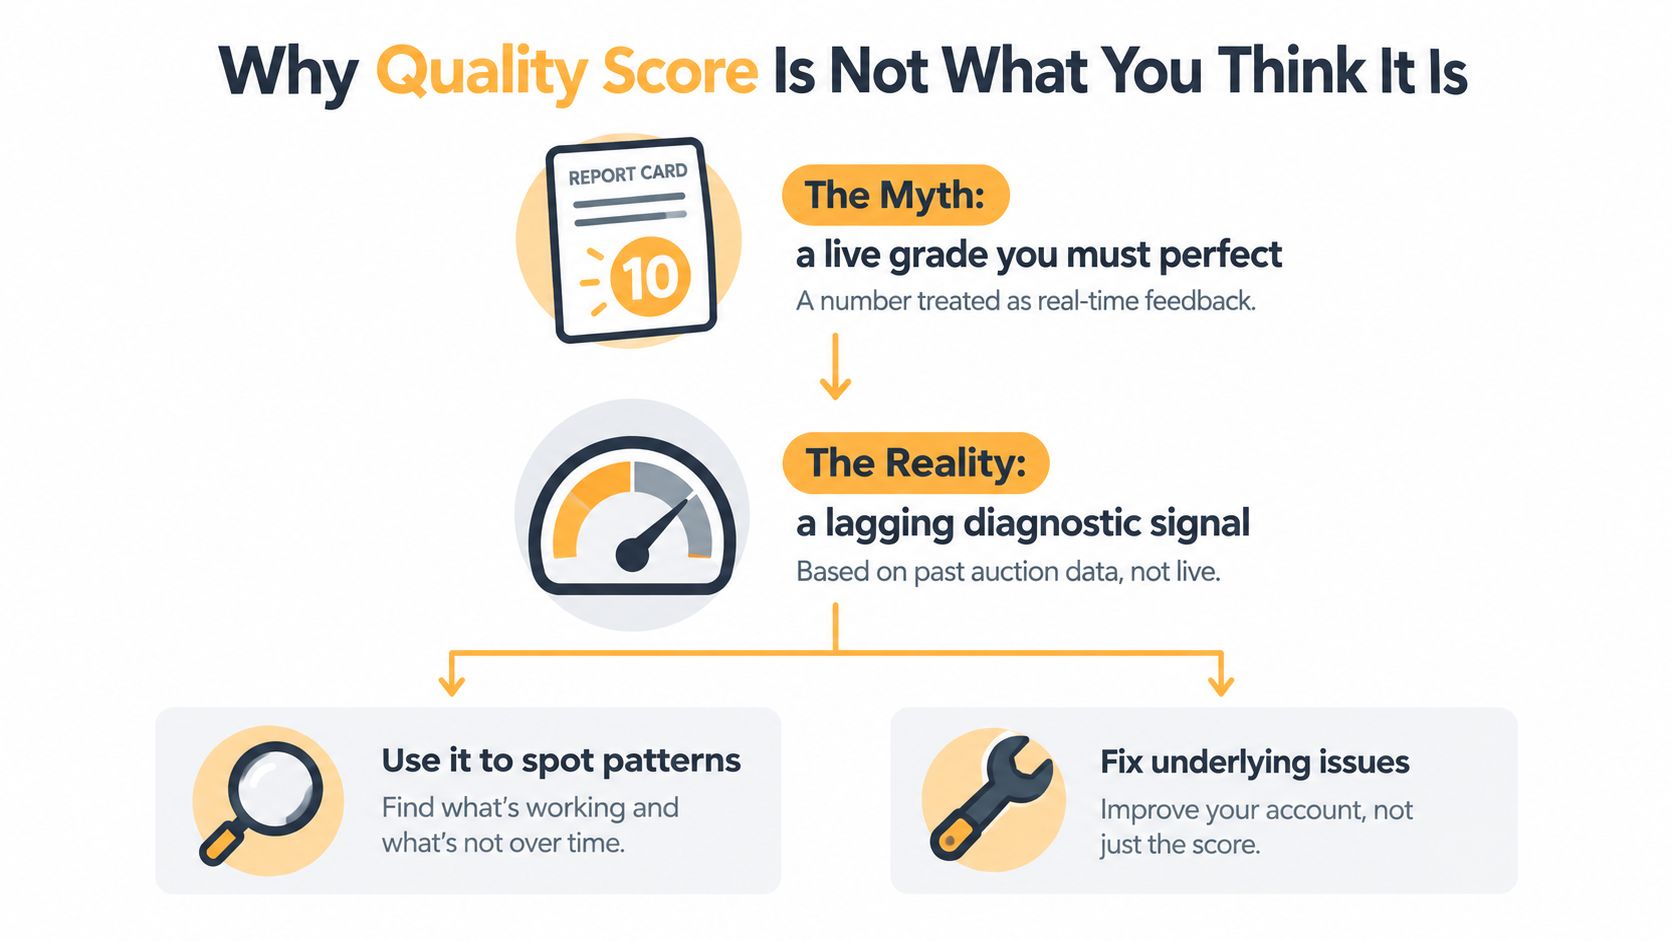
Practical rule: Use the report card to select a business problem, then judge the change by auction performance and account outcomes.
The score is a signal, not a success metric
A KPI measures an outcome that matters to the account, such as qualified leads, profitable revenue, or return on ad spend. Quality Score measures none of those outcomes. It also is not designed to become a meaningful account-level average, so combining keyword scores can create false confidence and distract from spend, intent, and conversion quality.
That limitation reflects a broader measurement problem. Marketers should treat attractive but incomplete metrics cautiously, as shown by these examples of misleading statistics. Quality Score can expose patterns across keywords, but it cannot replace search-term, cost, conversion, or revenue analysis.
Google added historical Quality Score columns to Google Ads on May 15, 2017, allowing advertisers to compare changes over time. Historical data is unavailable before January 22, 2016, and the historical columns show the last known score for the selected date range. With daily segmentation, the metric reflects the value recorded at the end of each day. If impression or click data is insufficient to estimate a score, Google displays a null value (Google’s historical Quality Score announcement).
Use the score and its components to find recurring weaknesses. Measure the fix through traffic quality, conversions, costs, revenue, and auction results, rather than pursuing a higher diagnostic number for its own sake.
The Three Ranking Signals Behind the Score
Quality Score is useful precisely because it is limited. The visible 1–10 number is a keyword-level diagnostic, not a direct readout of the quality Google uses in every auction. Use it to locate weaknesses, then diagnose the underlying component instead of chasing the number.
Google bases the diagnostic on three components: expected clickthrough rate, ad relevance, and landing page experience. Each component receives a status of above average, average, or below average. The comparison is made against advertisers whose ads showed for the exact same search over the last 90 days, as detailed in Google’s explanation of Quality Score components.
The comparison matters. An ad can be technically sound and still receive a below-average assessment when competing ads match the searcher’s intent more closely or offer a better destination. Google does not publish a weighting formula for the three components, so avoid optimization plans based on precise percentages from third parties. The practical question is which component is weak and whether fixing it improves auction performance and business results.
Expected clickthrough rate
Expected CTR estimates how likely a user is to click when the ad appears for the keyword. It differs from the raw CTR in your account because the diagnostic compares expected performance in context with other advertisers.
Improve it through the offer, message, specificity, and intent match. For a search for a particular service, name that service clearly and connect it to a meaningful benefit. Generic claims such as “Quality Service” or “Get Started Today” give less evidence of relevance than a specific promise tied to the query.
Ad relevance
Ad relevance measures how closely the ad matches the intent behind the search. Including the keyword can help, but placing it in a headline does not make the ad useful. A group combining different products, needs, or buying stages often forces one ad to make vague promises to several audiences.
A below-average relevance status across an entire ad group is a structural signal. Review the themes and search intent before rewriting every headline. Splitting unrelated themes may produce clearer ads than adding more keyword variations to the same message.
Landing page experience
Landing page experience reflects the destination’s relevance and usefulness after the click. Maintain message continuity. If the ad promises a particular service, product, price condition, or delivery option, the page should support that promise immediately and give visitors a clear next action.
Usability also affects the experience. Slow loading, poor mobile layouts, confusing navigation, and weak conversion paths can undermine a well-written ad. Diagnosing this component may require coordination among paid media, copywriting, design, development, and analytics.
How to Improve Expected Clickthrough Rate
Expected CTR is difficult to improve by chasing a benchmark in isolation. You improve it by making the ad a more persuasive answer to the specific search, while protecting lead quality. A headline that attracts irrelevant curiosity can lift clicks and weaken the economics of the campaign.
Start with the highest-value queries and inspect the language users type. The search terms report can reveal whether your keyword is serving product research, comparison, support, local intent, or an urgent buying need. Then write the ad around the dominant intent rather than around the keyword alone.
A practical sequence for ad improvements
- State the specific offer. Replace broad language with the product, service, category, or problem the user searched for. Specificity helps the user decide whether your result belongs in the consideration set.
- Lead with a meaningful benefit. Explain what the buyer gets, such as a simpler process, a relevant capability, or a clear outcome. Avoid unsupported superiority claims.
- Make the next step obvious. Use a call to action that matches the landing page. “Request a consultation” makes sense for a lead form, while “View available models” fits a product category.
- Test different value propositions. Keep the intent stable while varying proof, convenience, selection, service, or risk reduction. Don’t change every variable at once if you want to understand why an ad performs differently.
- Use assets to complete the message. Sitelinks, callouts, structured snippets, images, and other eligible assets can add useful information. They shouldn’t compensate for an unclear core ad.
Good ad copy isn’t merely a click-generation exercise. If the message attracts people who can’t buy, expected CTR may look healthier while conversion quality deteriorates. A senior buyer asks whether the ad attracts the right click, not just more clicks.
For a deeper treatment of message, benefit, and action design, use this guide to copywriting in advertising. The same principle applies here: make the promise concrete, make the audience recognizable, and ensure the page can deliver what the ad says.
A useful test: Read the ad without looking at the keyword. Can you identify the searcher’s problem, your offer, and the next step?
Avoid two common shortcuts. Raising bids won’t repair an unconvincing message, and stuffing keywords into every headline can make the ad sound mechanical. If the keyword itself has weak commercial fit, improving the copy may not solve the underlying problem. In that case, reconsider the targeting and the offer before pursuing a higher diagnostic score.
Optimizing Ad Relevance and Landing Page Experience
Ad relevance and landing page experience are often more controllable than expected CTR, but they require structural work rather than cosmetic edits. The most common mistake is sending several distinct intents into one ad group and then directing all of them to a generic page.
Align the ad group with one clear intent
Review each group as a user would. Do the keywords describe the same need, or are they just related by a broad category? If one group contains searches for different services, audiences, or use cases, split the structure and create ads that answer each intent directly.
Dynamic keyword insertion can support relevance, but it doesn’t replace message strategy. Repeating the search term isn’t the same as explaining why the offer fits. A well-organized responsive search ad should contain varied headlines and descriptions that remain coherent when combined.
Make the landing page continue the conversation
The page should confirm the click immediately. Match the central language, offer, and intent from the ad, then make the primary action easy to find. A user who clicked a campaign for a specific service shouldn’t have to move from the homepage to locate that service.
Use this landing page design guide to review the page beyond its headline. Check the form, calls to action, trust information, navigation, content hierarchy, and mobile layout. A page can look polished and still make the user work too hard.
Fix technical friction
Load speed deserves attention because users often abandon pages before they can evaluate the offer. Compress oversized media, remove unnecessary scripts, reduce layout shifts, and test the page on real mobile connections. Also verify that tracking fires correctly after a form submission or purchase. A page that converts but loses attribution can make a sound campaign appear weak.
Use a page performance tool such as PageSpeed Insights for technical diagnosis, then inspect the page manually on mobile. A technical score alone won’t tell you whether the copy answers the search.
The following walkthrough can help teams assess the relationship between ad traffic and landing page design:
Treat the page as part of the paid media system, not as a handoff after the click. When the same landing page issue affects multiple campaigns, one development or content fix can be more valuable than dozens of keyword-level edits.
Diagnostic Score Versus Auction-Time Quality
The visible score and auction-time quality describe related ideas, but they aren’t interchangeable. Quality Score is the historical diagnostic shown at keyword level. Auction-time ad quality is evaluated in the context of a particular opportunity to show an ad.
Google says the account-level Quality Score is not an input in the ad auction (Google’s explanation of the diagnostic score). That statement rules out a common operational mistake: treating a score of 10 as a direct bidding advantage or a score of 3 as an automatic reason to pause the keyword.
What the diagnostic can tell you
The score can show that one or more components are weaker than the comparative standard. It can also reveal patterns across related keywords. If many terms in one campaign show below-average relevance, the account may have a message or structure problem rather than a collection of unrelated keyword problems.
Historical columns make trend analysis possible, but they don’t turn Quality Score into a real-time dashboard. A recent landing page change may take time to appear in the historical diagnostic, and the score can remain null when Google lacks enough data.
What auction-time evaluation adds
At auction time, Google evaluates the quality of the ad and landing page alongside other factors, including the bid, thresholds, competition, search context, and expected impact of assets or ad formats. The specific user, query, device, location, and moment can change the result.
That distinction explains why a healthy campaign can contain a low-scoring keyword, and why a strong visible score doesn’t guarantee a top position. The diagnostic is a proxy for underlying quality. The auction evaluates the actual opportunity.
The operational implication: Improve the ad and page because they help users and auctions, not because a column needs to display a higher number.
This also changes how you report performance. Keep Quality Score in an audit or optimization view, but don’t place it beside conversions and revenue as though it were an equivalent business outcome. Use it to explain possible causes, then confirm those causes through actual search, click, and conversion data.
Prioritizing Fixes Across Large Keyword Sets
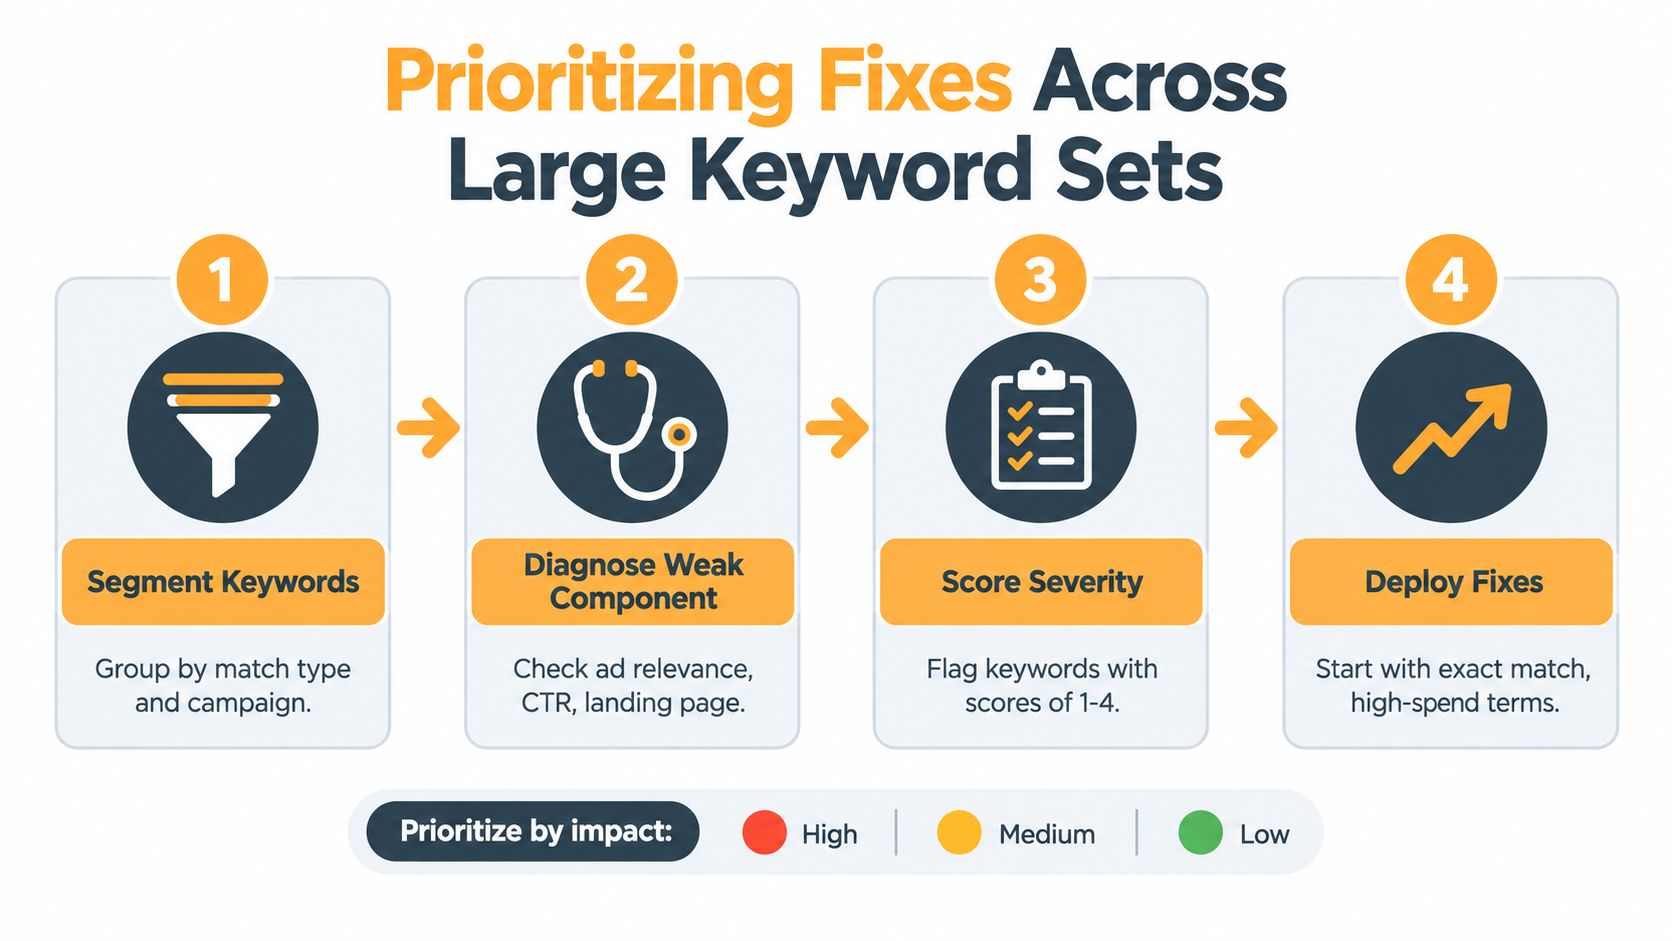
Large accounts create a prioritization problem. Several campaigns, match types, landing pages, and commercial themes can produce thousands of keyword-level diagnostics. Sorting only by the lowest visible score creates a tidy queue, but it may direct attention away from keywords that spend money or generate valuable demand.
Start with impact, then diagnose the component. Historical reporting lets you compare the last recorded score across selected periods, while daily segmentation can show the value recorded at the end of each day. The data still needs enough impressions or clicks to support an estimate, so a null value is not a problem to fix, per Google’s historical reporting guidance.
Build a useful work queue
- Segment the account. Separate campaigns, ad groups, match types, landing pages, and commercial themes. A tightly controlled service campaign should not be compared with a broad discovery structure as though both create the same diagnostic conditions.
- Sort by business impact. Begin with keywords that consume meaningful spend, drive qualified conversions, or represent strategically important products. A low score attached to negligible traffic can wait.
- Identify the failing component. Below-average expected CTR points to the offer, message, or audience fit. Below-average relevance suggests a mismatch between query intent, keyword grouping, and ad copy. Below-average landing page experience directs attention to the destination, usability, and mobile experience.
- Look for shared causes. One weak component across many keywords usually indicates a common fix. Review the ad group, campaign structure, templates, landing page, and tracking before editing individual terms.
- Validate with search terms and outcomes. Compare the diagnostic with actual queries, conversion quality, cost, and revenue. Broad matching can expose traffic that the keyword-level score does not fully represent, so the search terms report belongs in the same review.
- Recheck after the change. A structural rewrite may not produce an immediate score movement. Assess whether the new ads attract more qualified traffic and whether the page produces stronger user actions. Treat the score as supporting evidence, not the result itself.
A lower score can flag a useful investigation when it appears on an important keyword and a component is below average. It is not a universal pause rule. A keyword with a weak diagnostic can still produce valuable conversions, while a high-scoring term can attract traffic that does not support the business goal.
Fix patterns, not isolated symptoms
If relevance is below average throughout an ad group, separate mixed intent and rewrite the ads around the resulting themes. If landing page experience is weak across campaigns, investigate shared templates, generic destinations, mobile usability, and speed. If expected CTR is weak for a valuable term, improve the offer and message before changing bids.
Excellorix supports teams working across paid media, landing page development, conversion tracking, and optimization. Its digital marketing services can help align campaign messaging with the page users reach, while your team evaluates the work through qualified conversions and commercial results.
If your Google Ads account has a large keyword set, export score components, historical columns, spend, search terms, and conversion data into one working view. Then use Excellorix to discuss a focused audit or landing page improvement plan that addresses the weak component first, rather than chasing a headline score across the account.


