Skip to content


A 4:1 ROAS target is often treated as a sign of success. It is break-even only at a 25% contribution margin, and below that margin it loses money. At a 25% margin, every $4 in attributed revenue generates $1 in contribution before ad spend, leaving nothing to cover media costs. The right target depends on margin, not on a tidy benchmark.
Digital channels take a large share of marketers’ media budgets, but ROAS captures attributed revenue against ad spend, not the full cost of generating that revenue. A campaign can clear its ROAS target and still lose money once product costs and other expenses are included.
ROAS and ROI each answer a different question. Confusion arises when a team uses one to answer the other, without stating the contribution margin or attribution window behind the figure. At a 6.0 ROAS, those assumptions can determine whether the result represents profitable growth or a loss on every order.
Table of Contents
- ROAS vs ROI at a Glance
- How to Calculate ROAS and ROI Step by Step
- Why a High ROAS Can Still Lose Money
- What Attribution Can and Cannot Prove
- Choosing the Right Metric for Each Decision
- Set Targets and Build One Dashboard
ROAS vs ROI at a Glance
Return on ad spend measures how much attributed revenue each ad dollar produced. Return on investment measures how much net profit the total investment returned. That’s the whole difference in one line, and every practical consequence follows from it: what each metric counts as a cost, how fast it can be refreshed, and which decision it can safely support.
The two columns below aren’t two ways of describing the same performance. They answer different questions, at different speeds, for different audiences.
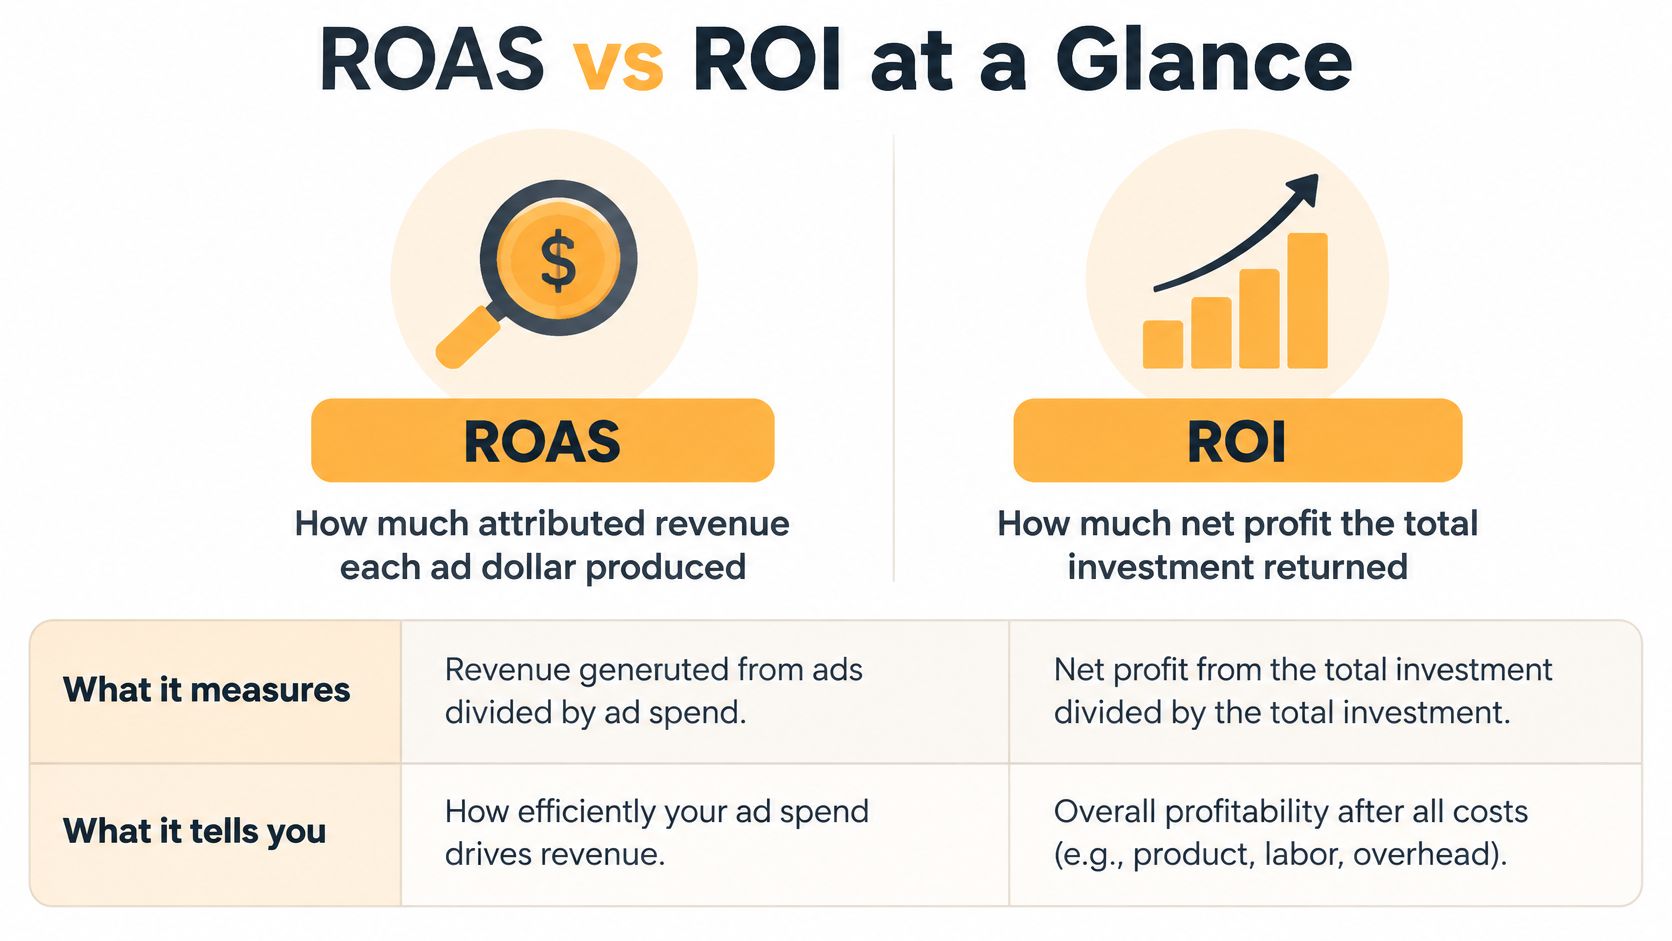
The distinction that matters: ROAS measures media efficiency. ROI measures economic return.
| Aspect | ROAS | ROI |
|---|---|---|
| Formula | Attributed conversion value ÷ ad spend | Net profit ÷ total investment |
| Result format | Ratio or percentage (5:1, 500%) | Percentage (50%) |
| Costs included | Ad spend only | Ad spend plus product cost, shipping, labor, fees and technology |
| Time frame | Usually campaign or channel, short window | Campaign, product or period, can span customer lifetime |
| Best use | Bid, budget and creative optimization | Business and budget decisions |
Three things the table implies. First, ROAS can’t fall below zero because both its inputs are positive amounts of money, while ROI turns negative the moment costs exceed revenue. Second, a platform will calculate ROAS for you and will never calculate ROI, because it doesn’t know what your product costs. Third, one campaign can pass one test and fail the other on the same day, using the same sales data.
The working rule is short. Use ROAS to steer bids, budgets and creative inside a channel, where the only variables are value and cost. Use ROI to decide whether the business is making money and where the next dollar of budget should go. Anyone who tells you a single account-level ROAS target covers both jobs is describing a target they can’t defend when the margin shifts.
How to Calculate ROAS and ROI Step by Step
The cleanest way to see both formulas run on one data set is the worked example in Google Ads Help. Six products cost $100 each to produce and sell for $200 each, and the advertiser spends $200 on Google Ads to move them.
The arithmetic holds whether you build it in a spreadsheet or read it off a dashboard, provided you don’t let the platform decide which costs belong in the numerator.
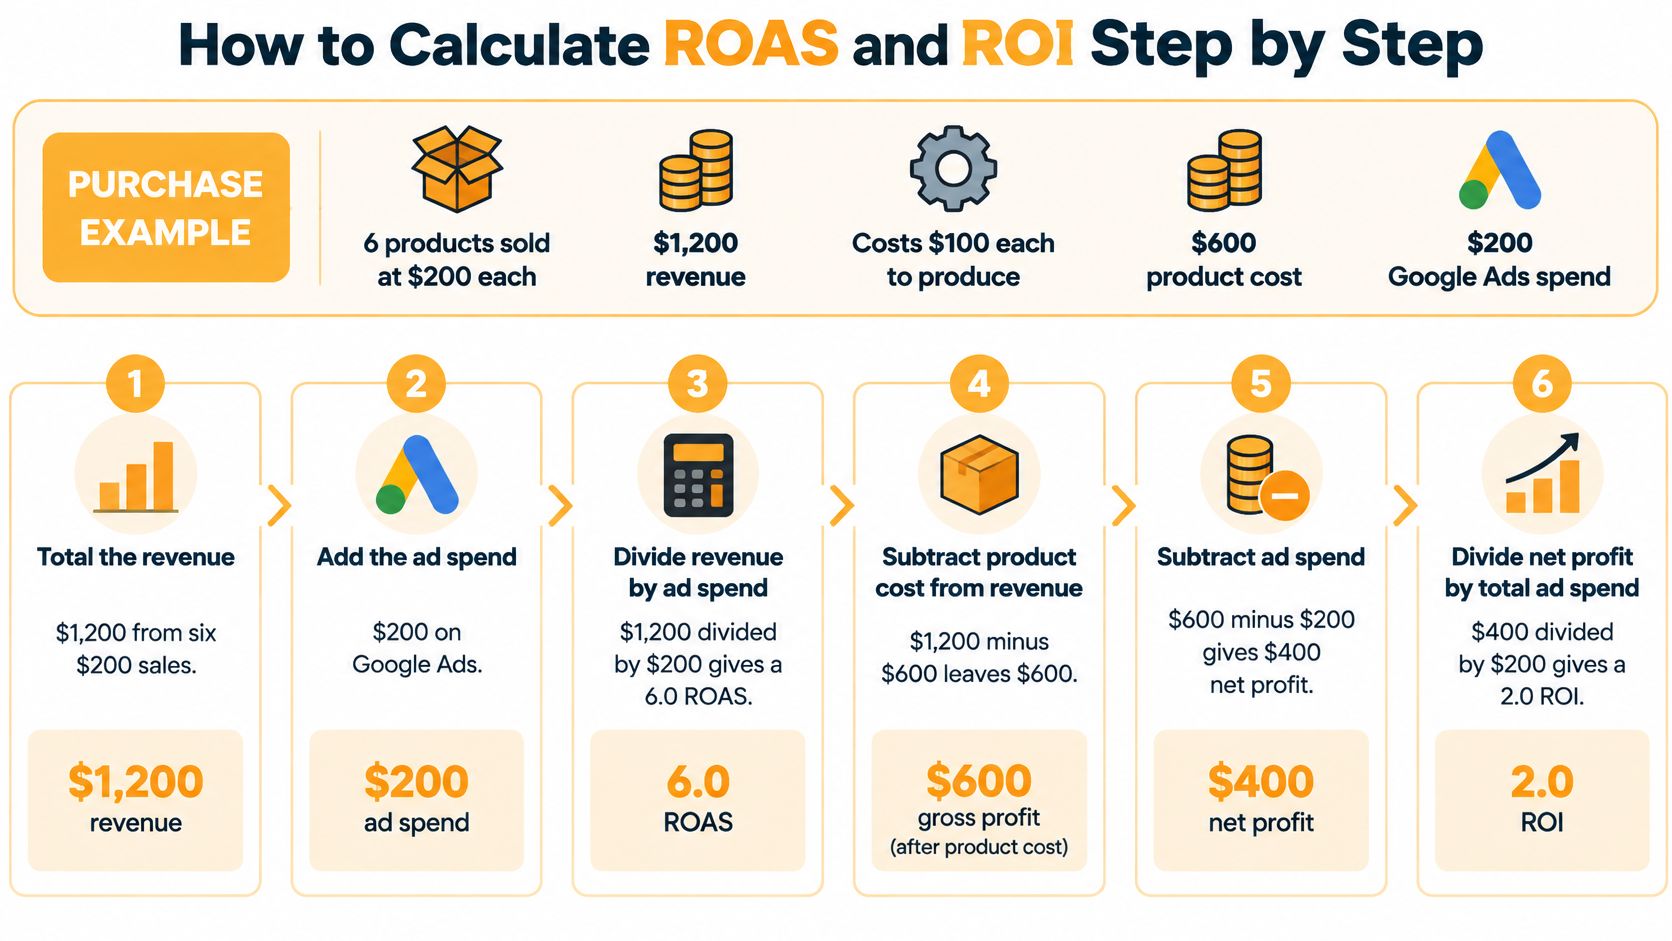
- Total the attributed revenue. Six units at $200 gives $1,200. Google’s example treats that as sales value, and most ad platforms would label it conversion value.
- Total the ad spend for the same channel and the same window. Here it’s $200 on Google Ads. Matching the window matters, because a seven-day spend against a thirty-day revenue pull will flatter any campaign.
- Divide revenue by ad spend. $1,200 ÷ $200 = 6.0, usually written 6:1 or 600%.
- Add product cost to ad spend. Six units at $100 is $600 of product, plus $200 of media, giving $800 of total investment.
- Subtract total investment from revenue. $1,200 − $800 = $400 of net profit.
- Divide net profit by total investment. $400 ÷ $800 = 50%, which Google reads as $1.50 returned for every $1 invested.
Why the same campaign reports 6.0 and 50
Both figures are correct because they divide different numbers by different denominators. ROAS stops at the sale and compares revenue with media. ROI walks past the sale, picks up the $600 of production cost, and compares what’s left with everything committed.
There’s a structural point underneath the arithmetic. The ROAS numerator is whatever the ad platform credits to itself. The ROI numerator is money that exists in your accounts after refunds, chargebacks and discounts settled. Those two numbers diverge by design, and the gap widens on branded search and retargeting.
| Item | Value | Metric it feeds |
|---|---|---|
| Attributed revenue (6 units at $200) | $1,200 | ROAS and ROI |
| Product cost (6 units at $100) | $600 | ROI only |
| Ad spend | $200 | ROAS and ROI |
| Total investment (product cost plus ad spend) | $800 | ROI only |
| ROAS result | 6.0 (600%) | ROAS |
| ROI result | 50% | ROI |
Checkpoint: When a campaign shows a high ROAS and a low ROI, the cost base is the first place to look, not the media. Product cost, discount depth, shipping and returns each carry a line you can audit, and one of them normally explains the gap.
Why a High ROAS Can Still Lose Money
Start with the case that should end the argument. Google’s guidance on ROAS and ROI works through a 4.0x ROAS on a product with a 25% gross margin and shows it produces only 1.0x gross profit before fulfillment and other costs land. After those costs, the campaign may be unprofitable. A ratio that reads like a solid result on a dashboard can describe a loss.
The image below is the version of that scenario most operators recognize. Healthy numbers on screen, unopened inventory on the floor.
Break-even ROAS is a margin calculation
The minimum ratio at which advertising covers the product it sells is 1 ÷ gross margin. That isn’t a benchmark lifted from an industry report. It’s arithmetic, and it moves every time a cost changes.
| Gross margin | Break-even ROAS (1 ÷ margin) | Reading |
|---|---|---|
| 20% | 5.0 | Every $1 of ads needs $5 of revenue before any other cost |
| 25% | 4.0 | Below 4.0 the campaign loses money before overhead |
| 33% | 3.0 | Below 3.0 the campaign loses money before overhead |
| 40% | 2.5 | Below 2.5 the campaign loses money before overhead |
| 50% | 2.0 | Below 2.0 the campaign loses money before overhead |
A marketing measurement review from Swydo puts the same relationship in contribution terms: a business with a 20% contribution margin needs roughly 5.0 ROAS before variable costs are fully covered, while a business at 50% needs roughly 2.0. Those two numbers explain why the copied target is dangerous. The same 4.0 threshold is generous at a 50% margin and a guaranteed loss at 20%.
Where the money goes after the sale
ROAS counts ad spend as its only cost. Everything else sits outside the metric, including gross margin, fulfillment, returns, discounts, agency fees, payment costs and customer support. Those lines don’t vanish because the dashboard omitted them.
Name them in the order they bite and the picture sharpens. Discount depth cuts revenue before ROAS ever sees it. Returns reverse revenue after the platform has already booked it. Payment fees and fulfillment scale with volume, so a campaign that looks efficient per order gets worse as it grows. Retainers and tooling are fixed per month, which means they press hardest on small accounts.
Targets belong on margin bands and cohorts
One ROAS target for a whole catalog hides the products that lose money. The target should shift by product, by customer cohort and by payback period, because a first-order ratio undervalues an acquisition that repeats and overstates one that refunds.
A margin-aware view of how to reduce customer acquisition cost makes the trade explicit. You can buy a first order at a loss if the cohort pays back inside a window you’ve defined, and you can’t if it doesn’t.
The test before the next budget increase: apply gross margin and operating costs to incremental revenue rather than attributed revenue, then divide by total investment. If the resulting contribution return clears zero after payback, scale. If it doesn’t, the ROAS you’re defending is decoration.
What Attribution Can and Cannot Prove
A reported ROAS shows which sales a platform credited to an ad. It does not establish that the ad caused those sales. Attribution assigns credit under a defined rule; incrementality testing estimates what changed because of advertising. Google’s measurement guidance discusses using attribution alongside incrementality testing and marketing mix modeling.
Where attribution can overstate ad impact
Attribution records touchpoints, while an incrementality test compares outcomes with and without advertising. The gap can be especially relevant in placements where customers already show strong purchase intent:
- Branded search. A customer who searches for your brand and clicks an ad may have purchased anyway.
- Retargeting. A visit can trigger an ad, then the resulting purchase gets credited to that ad.
- Email-assisted purchases. When a newsletter click precedes a paid click, the attribution model determines how credit is divided.
- High-intent audiences. These segments may convert because of existing intent, not because an ad created it.
These cases do not make the attribution rule invalid. They do mean attributed ROAS can overstate the revenue caused by advertising, particularly when the campaign reaches people already close to buying.
How to test incrementality
Use holdout groups or geo tests, and set the primary outcome before the test begins. Then compare results with CRM or financial data so the measured lift reflects recorded revenue, not only conversions counted by an ad platform.
Marketing mix modeling can assess how a budget performs across channels that share credit, while a single-channel test isolates a narrower question. Google’s open-source Meridian model is one example of a marketing mix tool that makes causal measurement more accessible to mid-sized accounts, not only enterprises with research teams.
The attribution window changes the number
A lower reported ROAS after changing to a stricter attribution window may reflect less credit assigned to the campaign, rather than weaker performance. State the window in each report and keep it consistent between periods. Otherwise, a reporting change can look like a performance drop.
Three questions before trusting a ROAS figure: Which conversions count? What attribution window is used? Has a holdout test confirmed incremental lift?
Reliable tests depend on accurate event setup. Proper conversion tracking in Google Analytics helps prevent duplicated purchase events from inflating ROAS or missing events from understating it.
Choosing the Right Metric for Each Decision
The rule that settles most of these arguments is about reversibility. Use the ratio for decisions you can undo tomorrow at low cost, such as a bid, a budget shift between ad sets, or a creative swap. Use the profit measure for decisions that commit money, headcount or inventory, where a mistake takes a quarter to unwind.
Confidence isn’t the constraint. Nielsen’s 2024 Global Marketer Survey found that 84% of global marketers were extremely or very confident in their ROI-measurement capabilities, compared with 69% in 2023. Teams believe they can measure. What they skip is naming the decision before choosing the metric.
| Decision | Primary metric | Supporting metric | Why |
|---|---|---|---|
| Bid and creative changes in live search or shopping campaigns | ROAS | Cost per conversion | Bids respond to value per dollar in near real time |
| Comparing channels with the same gross margin | ROAS | Incremental revenue test | Equal margins make the ratio comparable |
| Deciding whether a product line is profitable | ROI (contribution) | ROAS | Includes product cost, fulfillment and returns |
| Approving a total marketing budget | ROI | Payback period | Covers all costs and the time to recover them |
| Lead generation with no revenue data yet | Cost per lead | ROAS once revenue is tracked | ROAS cannot be calculated without revenue |
| Subscription or repeat-purchase business | Cohort ROI over 12 months | First-order ROAS | Lifetime value shows returns that first-order ROAS misses |
Where margin breaks the comparison
Two channels reporting 5.0 and 3.0 aren’t ranked by those numbers alone. Say the 5.0 channel sells at a 20% margin and the 3.0 channel sells at 50%. The lower ratio earns more profit on the same revenue, and a dashboard sorted by ROAS will recommend the wrong shift.
That’s the trap in channel scorecards. A ratio comparison is only fair inside a margin band, so group channels by product economics before you rank them. For a mixed catalog, put the printed number next to the margin band in the same column, or the ranking will favour the cheapest thing you sell.
Where a metric can’t be computed, record the gap instead of filling it. A lead-generation program with no revenue tracking has no ROAS, and estimating one from form fills invents a number nobody can audit.
Set Targets and Build One Dashboard
A dashboard can show strong ROAS while the business loses money. Set targets against your own costs, then label each metric by what it measures.
WARC’s analysis of advertising efficiency covers 1,537 successful advertising campaigns and reports median revenue ROI of 4.33:1 and median profit ROI of 2.5:1. Revenue ROI reflects incremental sales; profit ROI accounts for the economics remaining after campaign costs. The difference shows why a market benchmark cannot set a safe target for a business with different margins and costs.
The hierarchy that keeps reporting honest
Use platform ROAS for fast bidding decisions. Validate incremental revenue through controlled tests or media-mix analysis to estimate how much revenue advertising caused. Then assess profit ROI using product-level gross margin, returns, shipping, discounts and retention effects.
WARC distinguishes incremental sales value, incremental gross profit, incremental net profit and net-profit ROI, calculated as incremental net profit divided by media spend. Label the chosen definition on every chart. Otherwise, a dashboard can make performance appear better or worse by switching measures.
Respect the time horizon
Set the measurement window to match how customers buy and return. A first-order ROAS omits later purchases and other value that arrives after the initial conversion, while a long window can make weak short-term economics look stronger than they are.
A thirty-day payback window may suit a low-margin consumable with fast repeat purchases. It may misjudge a considered purchase with a ninety-day decision cycle. Choose a window that reflects the product’s buying cycle, and compare campaigns using the same window.
Build one dashboard in two layers
Keep fast operating measures separate from longer-term business outcomes. Layer one tracks channel ROAS, cost per acquisition and conversion rate for bid and budget decisions. Layer two tracks contribution ROI, payback period and cohort revenue for monthly and quarterly decisions.
- Record gross margin and allocated operating costs by product. Include fulfillment, payment fees, returns, discounts and any agency or tooling costs you allocate.
- Set a channel target using break-even ROAS for that margin. Add a buffer for operating costs the ratio excludes.
- Check conversion tracking and state the attribution window in the dashboard header. This keeps comparisons consistent across periods.
- Test incrementality on significant branded or retargeting spend. These campaigns can receive credit for revenue that may have occurred without the ad.
- Review profit ROI monthly, then move budget only when the operating and outcome measures support the decision. If ROAS rises while contribution falls, the campaign mix may be generating cheaper but less profitable revenue.
Excellorix ties every monthly report to revenue outcomes, including revenue growth, customer acquisition cost, ROAS, conversion rate, average order value and customer retention rate. Its PPC reporting also connects performance to real revenue impact, while PPC success is measured mainly through cost per lead, cost per acquisition, ROAS and conversion rates, not clicks and impressions as primary indicators.
A marketing analytics dashboard can put those measures in one view while keeping their definitions distinct. The decision is whether additional spend is expected to return more than it costs after product economics and the chosen attribution window are accounted for.
Break-even check: Write down the gross margin for your five best-selling products. Divide 1 by each margin to calculate its break-even ROAS, then compare that threshold with each product’s average ROAS over the last 30 days. A product below its own threshold needs investigation before more budget is committed, even if the account-level average looks strong.
Excellorix provides monthly reporting and strategy calls so clients can see what changed and why. Set targets from product margins and review ROAS alongside contribution, rather than relying on an account-level ratio alone.