Skip to content


The average large-scale ecommerce site could achieve an approximately 35% relative conversion-rate increase through checkout design improvements alone, according to Baymard’s checkout usability testing. That reframes landing page conversion rate optimization: the opportunity isn’t necessarily a better headline or more traffic. Sometimes visitors want the offer, but struggle to finish the purchase.
Effective optimization follows the whole journey, from the promise that earned the click to the completed purchase or qualified inquiry. It also separates audiences, devices, and acquisition channels, because a higher headline conversion rate doesn’t automatically mean a healthier business.
Table of Contents
- Landing Page Conversion Rate Benchmarks by Industry
- How Landing Page Conversion Rate Optimization Works
- Key Elements That Lift Landing Page Conversions
- Forms and Checkout Steps That Hold Visitors
- Mobile and Desktop Gaps to Diagnose
- Metrics That Prove Impact and AI Referral Tracking
- Running Your First Landing Page Test
Landing Page Conversion Rate Benchmarks by Industry
6.6%. That is the cross-industry median landing page conversion rate in the 2024 landing page benchmark summarized by MarketingProfs, based on more than 41,000 landing pages, 464 million unique visitors, and 57 million conversions.
A median is the middle result. Half of those pages converted above 6.6%, and half converted below it. It is context for a large mix of offers, not a score your page has to clear.
Conversion rate = conversions ÷ unique visitors × 100.
Name the conversion before you calculate it. A completed purchase, a booked consultation, and a downloaded guide ask for different commitments. If your analytics platform counts sessions rather than unique visitors, label that denominator and keep it the same in every comparison. Mixing the two makes a gain look larger or smaller than it is.
Median landing page conversion rates by segment
| Segment | Conversion rate | What it tells you |
|---|---|---|
| All industries | 6.6% | Cross-industry median across 41,000+ landing pages |
| Financial services | 8.4% | Median for financial-services landing pages |
| SaaS | 3.8% | Median for SaaS landing pages |
| Other industries | 3.8% to 12.3% | Range of industry medians |
Those medians already disagree. Financial services sits at 8.4%. SaaS sits at 3.8%. Other industry medians in the same benchmark run from 3.8% to 12.3%. A single universal target blends visitors who arrived with different intentions and were asked to do harder or easier things.
A published median works like a regional speed sign. It says what is ordinary on that kind of road. It does not say whether your street, with this traffic, is fine.
Turn the benchmark into a useful comparison
Start with the closest industry. Then build a baseline that matches the page in front of you.
- Match the business model. A software trial page is not a product checkout or a healthcare appointment request.
- Split traffic you can name. Email subscribers often already know the offer. Visitors from a broad social campaign may still be weighing the problem.
- Check the untagged slice. Referrals from AI tools can arrive without a source label and land inside direct traffic. One blended rate then hides which visits converted.
- Separate device. The same URL can convert differently on a phone and on a desktop because the post-click path is not the same. Compare each device with its own history.
Record the intended action, audience, acquisition source, and measurement window before you call a rate disappointing. Inside one company, an educational download and a sales inquiry should not share a target. Rates vary by segment, and attribution gets noisy when sources are missing.
Practical rule: Use benchmarks to identify questions, not to issue a verdict on a page.
A hypothetical SaaS page can sit under the 6.6% cross-industry median and still improve. If a controlled test lifts its own starting rate among comparable visitors, that lift is the result that matters. The useful question is whether those visitors became more likely to complete a valuable action.
How Landing Page Conversion Rate Optimization Works
A landing page is a bucket under a tap. Traffic is the water; conversions are what stays in the bucket. Buying more visits increases the flow, but optimization finds and fixes the leaks.
The analogy helps separate acquisition work from conversion work.
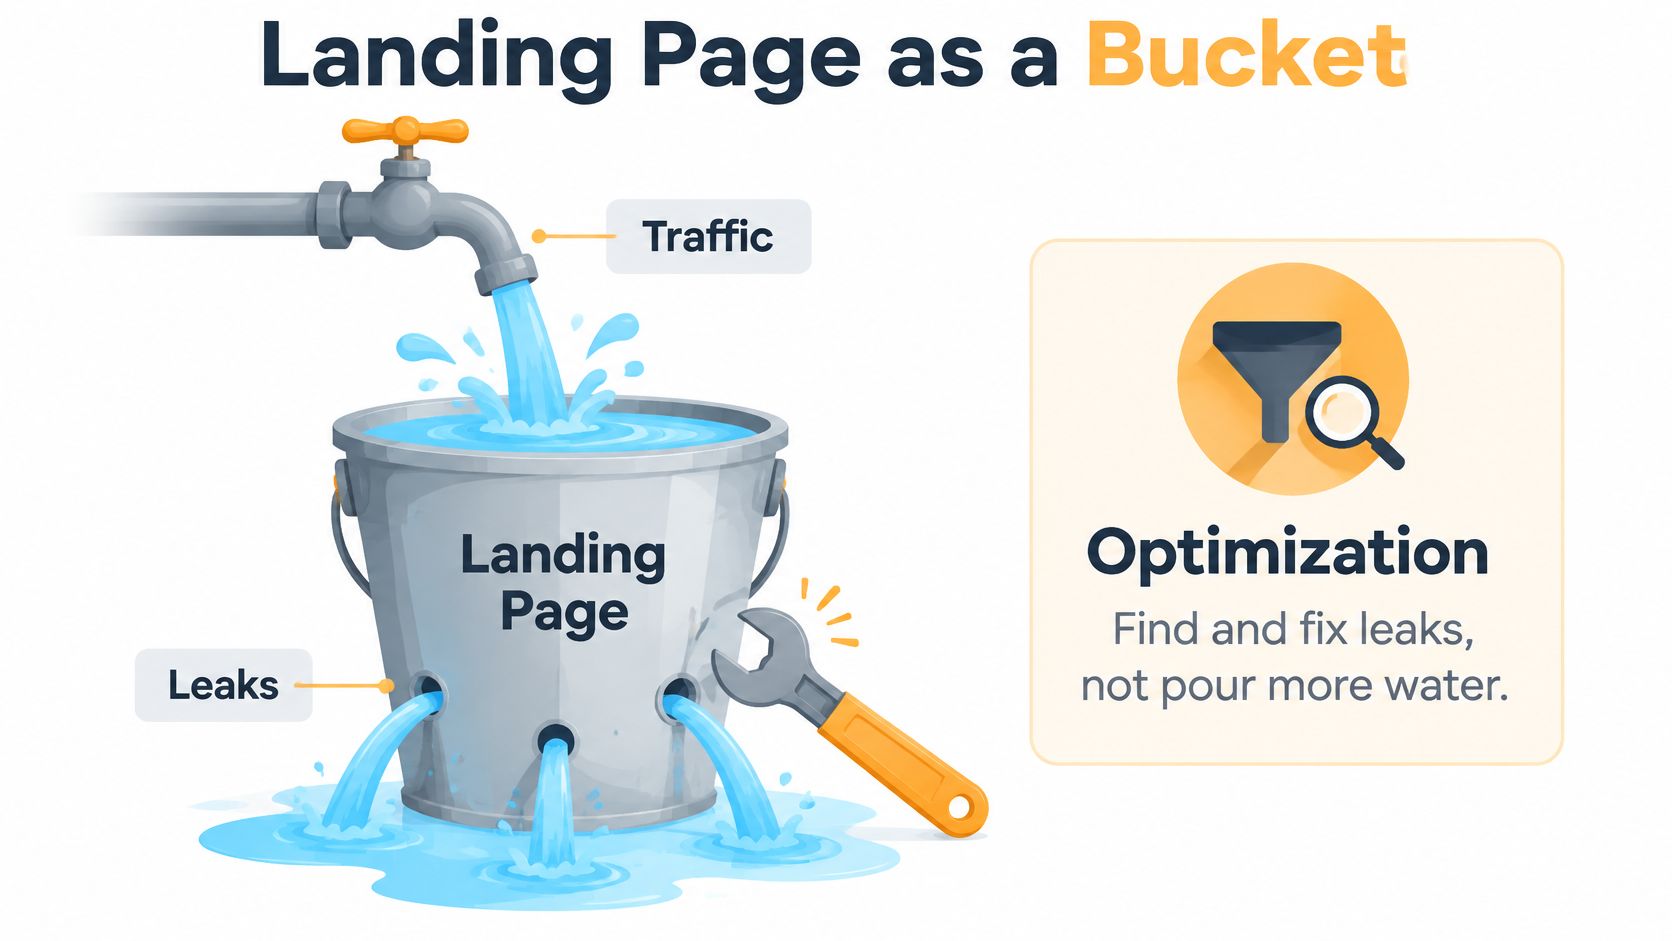
Conversion rate optimization, or CRO, systematically improves the share of visitors who complete the page’s intended action. That involves auditing the funnel, testing what works, and improving the steps customers must complete, not changing page decoration.
Follow a customer through the purchase
Say a shopper clicks an ad for a skincare starter kit. The landing page attracts attention, but the shopper still has to understand the offer, trust the seller, choose the product, and pay.
Map that journey in order:
- The click. Identify what the ad or search result led the shopper to expect.
- The promise. Check whether the destination clearly presents that same offer.
- The proof. Give the shopper relevant evidence to evaluate the product.
- The action. Make the intended next step clear, whether that’s adding to cart, calling, or completing a form.
- The completion. Follow the shopper through checkout and confirmation, rather than stopping measurement at the button click.
A leak after the primary button still matters. If shoppers add the kit to their carts but can’t understand delivery costs, an attention-grabbing hero image won’t resolve their hesitation.
Reduce the work required to finish
Checkout improvements target interaction cost, the effort needed to enter information, understand charges, recover from errors, and review an order. Keep the offer consistent through checkout, expose total costs early, and make guest checkout easy to find where available.
Instrument the transitions between steps so you can distinguish hesitation from technical failure. Treat any projected uplift as a possibility to validate, not a promised result.
Before changing anything, map your own journey from acquisition click to thank-you page using those stages. At each transition, record what the visitor needs to know and what could prevent them from continuing.
Key Elements That Lift Landing Page Conversions
Audit a landing page from the visitor’s perspective, not the designer’s. Someone arriving from a campaign needs to recognize the offer, evaluate it, and understand what happens next.
Use this checklist while reviewing the page on an actual phone and desktop screen.
Check the essentials before polishing the design
- Message match. Repeat the ad or search promise in the headline using recognizable wording, so visitors don’t have to infer whether they’ve reached the right offer.
- One primary action. Give the main button a specific label, such as Get my quote rather than Submit, so the next step is clear.
- Above-the-fold value. Show what the offer is, who it’s for, and relevant proof within the opening screen so visitors can decide whether to continue.
- Trust evidence. Place genuine reviews, documented client results, or relevant certifications near the action, where visitors can use them while deciding.
- Visual hierarchy. Use contrast, whitespace, readable text, and a purposeful product or outcome image to guide attention.
- Objection handling. Put relevant pricing, delivery, returns, eligibility, or cancellation information close to the decision it affects.
These are testable design choices, not universal guarantees. A complex industrial purchase may need specifications and procurement information, while a consultancy inquiry may need a clear explanation of the first conversation.
Use landing page design best practices for conversions as an audit framework, then prioritize the issues your visitors encounter.
Turn a checklist observation into a test
Say a consultancy page gives equal prominence to booking a call, downloading a brochure, and subscribing to updates. The page also makes broad claims without showing evidence that the consultancy can solve the visitor’s problem.
A sensible initial hypothesis is that visitors can’t identify the intended next step. Test a dominant consultation action while keeping the supporting material available but visually secondary.
Then test relevant, permission-cleared client evidence near that action. Separating those changes helps you understand whether clearer direction or stronger proof affected the result.
Don’t confuse one primary action with a rule that every useful link must disappear. Visitors may still need accessibility controls, privacy information, or product details to make an informed decision.
Start by finding the earliest break in message match. If the destination appears to offer something different from the campaign, investigate that mismatch before spending time on button styling.
Forms and Checkout Steps That Hold Visitors
| Checkout comparison | What to investigate |
|---|---|
| A streamlined checkout | Which elements are necessary to complete the order? |
| The current checkout | Which elements appear by default without a clear purpose? |
| A difficult checkout | Where do shoppers encounter confusion, errors, or unnecessary work? |
Baymard’s checkout benchmark and usability report says an ideal ecommerce checkout can be reduced to roughly 12–14 form elements, compared with 23.48 elements displayed by default in the average U.S. checkout; its separate usability research found 17% of online shoppers had abandoned an order because checkout was too difficult.
Those findings support a field audit, not indiscriminate deletion. Shipping information may be essential for fulfillment, while an optional preference question might be better asked after purchase.
Make every field justify its place
Apply these questions to each field:
- What business purpose does it serve? Identify its role in qualification, fraud prevention, fulfillment, or lifecycle personalization.
- Is it needed now? Defer secondary information through progressive profiling, collecting it during later interactions.
- Can visitors answer confidently? Explain unfamiliar requests and avoid asking for information they’re unlikely to have available.
- What happens when they make a mistake? Preserve their entries and provide a specific correction beside the affected field.
Keep labels visible after typing begins. Mark required fields explicitly, use suitable input types and autocomplete attributes, and avoid formatting rules that reject otherwise valid information.
For phone numbers and addresses, account for the regions you serve. A field that accepts only one local format can prevent an otherwise qualified visitor from finishing.
A shorter form is useful only if it improves the outcome the business actually needs.
Test completion and qualification together
Compare a shorter form with the existing version while holding the offer, traffic allocation, button treatment, and validation behavior constant. Track field-level abandonment and validation errors to understand the mechanism behind any change.
Then connect submissions to CRM outcomes. Measure qualified leads, downstream revenue, and acquisition cost, not just successful form events.
For example, a form that removes a company-information question might generate more inquiries but require sales staff to reject more unsuitable prospects. Judge the change by the cost and value of qualified outcomes, including the work needed to process them.
Mobile and Desktop Gaps to Diagnose
Mobile-first design doesn’t mean mobile-only measurement. Ciqra’s landing page optimization overview reports that mobile represented 83% of landing-page visits, while desktop converted about 8% better, and that dynamic pages converted about 25.2% more mobile users than static pages.
The dynamic-page comparison is an association, not proof that personalization caused the difference. Audience selection, campaign intent, and implementation quality could also influence the result.
Review device behavior alongside the complete customer journey.
Diagnose the gap before redesigning
Ask questions that distinguish device friction from differences in intent:
- Are phone visitors researching before buying elsewhere? Examine consented, signed-in journeys or CRM-linked activity where available, and acknowledge the limits of anonymous cross-device tracking.
- Do high-intent actions fail on small screens? Test forms, calendar widgets, payment options, and sticky buttons on real devices, including with the keyboard open.
- Is the experience slower or less reassuring? Measure real-user loading behavior and inspect whether important delivery, security, or service information becomes difficult to find.
Use Google Analytics device reports to locate differences, then investigate with browser testing, form-error events, and privacy-appropriate session recordings. A device report identifies where to look; it doesn’t establish the cause.
Evaluate personalization as an experiment
For a dynamic page, define the targeting rule before launch. Keep eligible visitors in comparable control and treatment groups, and measure page performance as well as conversion outcomes.
Check whether personalization delays the main content, exposes sensitive assumptions, or changes the promise unexpectedly. Visitors shouldn’t receive contradictory prices or service expectations because a targeting rule misclassified them.
Consider a hypothetical DTC redesign that improves immediate mobile purchases while desktop sales decline. Without examining total revenue and device-assisted journeys, the team could celebrate a local improvement while missing a broader loss.
Judge a mobile change by what it does for customers and revenue, not simply by the device on which the final action appears.
Metrics That Prove Impact and AI Referral Tracking
Metrics that show real landing page impact
| Metric | What it shows | Blind spot |
|---|---|---|
| Conversion rate | Share of sessions completing the action | Can rise while lead quality falls |
| Lead quality rate | Share of leads that qualify for sales | Needs CRM follow-up to measure |
| Revenue per visitor | Revenue divided by sessions | Slow to read for long sales cycles |
| Cost per conversion | Spend divided by conversions | Can hide poor lead quality |
| Assisted conversions | Conversions where the page was touched earlier | Credit changes with the attribution model |
For a session-based dashboard, use the session denominator consistently. If your reporting uses visitor-based conversion rate or revenue per unique visitor instead, rename those measures rather than switching definitions.
Choose a primary metric that represents the page’s job, then add guardrails. A consultancy might prioritize qualified consultation requests; an ecommerce campaign might prioritize purchase conversion while monitoring revenue and acquisition cost.
Account for AI referrals without overstating attribution
Patrick Stox’s guide to AI traffic attribution explains that AI referral information may be missing, leaving visits classified as Direct, and describes emerging practitioner evidence of stronger conversion performance from some AI-referred visitors.
Those comparisons are directional because methodologies differ. Don’t substitute an emerging channel claim for your own observed performance.
Build a practical measurement setup:
- Establish a Direct-traffic baseline. Review usual landing pages, campaign periods, and qualified outcomes before attributing an increase to AI discovery.
- Create an AI-specific channel grouping. Classify identifiable AI referrers separately while leaving unknown traffic unassigned.
- Tag controlled campaigns where possible. Use consistent campaign parameters for links you control, without assuming external tools will preserve them.
- Compare business outcomes. Examine qualified conversions, revenue, assisted conversions, and lead quality rather than celebrating additional sessions.
Use conversion tracking in Google Analytics to support consistent event definitions and connect acquisition reporting to meaningful actions.
Treat a Direct spike as a clue
Suppose Direct visits to a specialist service page rise after someone shares a chatbot recommendation. Check timing, landing-page patterns, identifiable referrals, and voluntary lead-source responses before drawing a conclusion.
Don’t relabel the entire increase as AI traffic. Direct can include several kinds of unattributed visits, and source questionnaires provide supporting evidence rather than perfect attribution.
The useful contrarian idea is that a lower-volume channel can deserve substantial attention when its visitors produce better qualified outcomes. Budget decisions should reflect that demonstrated value, not traffic volume alone.
Running Your First Landing Page Test
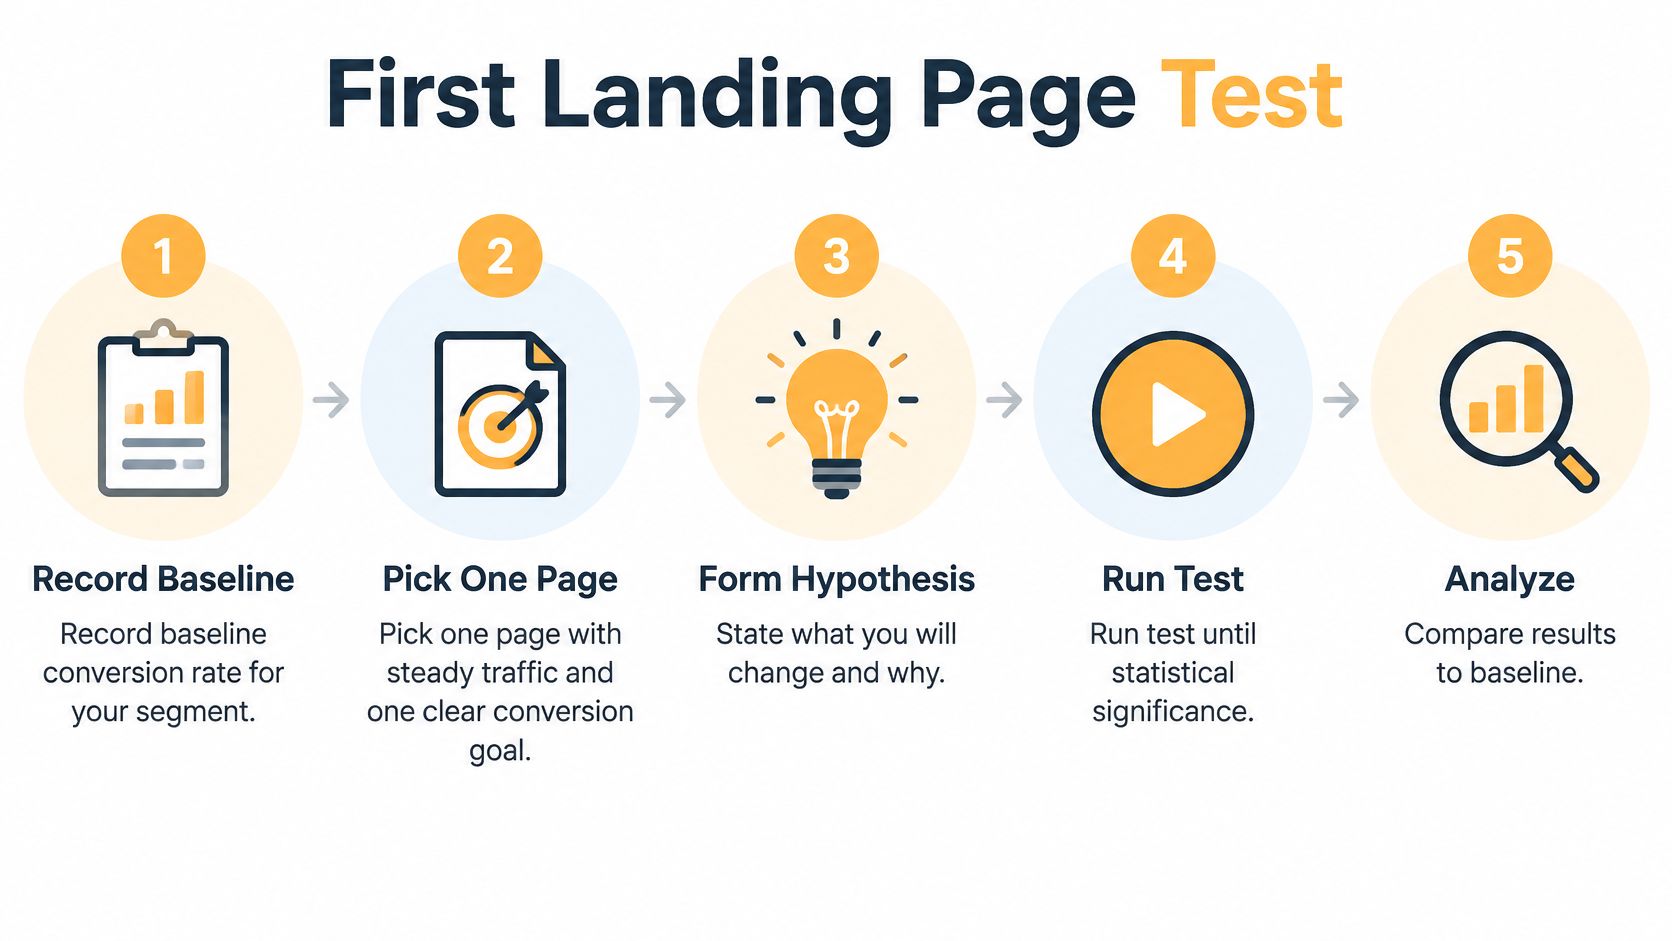
Start with a question you can answer cleanly. A narrow experiment is easier to interpret than a redesign that changes the audience, offer, layout, and form simultaneously.
Use this process as a planning aid, but set the analysis rules before launch rather than stopping whenever a dashboard first displays significance.
Set up a test you can interpret
-
Record the segmented baseline. Document the existing page’s performance for the intended audience and conversion event. Treat industry benchmarks as context, not a pass mark.
-
Pick a stable page and a clear goal. Choose a page with dependable traffic and functioning measurement. Avoid testing during an unrelated offer change or migration.
-
Write the hypothesis. Use this structure: because visitors from this source need X, changing Y should improve Z. For example, visitors evaluating a consultancy may need to understand what the introductory call includes.
-
Change a single variable. Test the headline, primary button wording, or form length while keeping other conditions comparable. This makes the result easier to connect to the proposed explanation.
-
Calculate the required sample. Use the baseline, the smallest commercially meaningful effect, and your chosen confidence and power settings. Understand statistical significance in A/B testing before selecting a stopping rule.
-
Allocate traffic consistently. Split eligible visitors evenly, preserve their variant assignment, and include complete weekly cycles. Don’t stop early because the initial result looks attractive.
Decide, document, and continue
-
Read the primary result and guardrails. Check qualified outcomes and revenue before declaring a winner. If the sample remains insufficient, report the result as inconclusive rather than forcing a decision.
-
Ship the supported change and log it. Record the hypothesis, variant, segment, dates, sample, outcome, and implementation decision. Include unsuccessful tests so the next person doesn’t repeat an already tested assumption.
That log turns isolated experiments into a useful operating record. Each new test still needs its own baseline, but the team can start with clearer evidence about what to investigate next.
Excellorix offers landing-page audits, A/B testing, and analytics implementation to help identify where visitors struggle and which changes improve qualified outcomes. If your business is already online, our free growth plan includes a technical audit and a ranked view of where the funnel is leaking revenue. Visit Excellorix to request the plan and identify a focused starting point for your next test.