Skip to content



Your testing dashboard has turned green. The new landing page is ahead, someone has posted the result in Slack, and the team wants to roll it out before the next campaign starts. You’re about to approve the change when someone asks the question the dashboard hasn’t answered: will this make us more money?
That’s the useful way to approach statistical significance in A/B testing. It helps you judge evidence against a no-difference assumption. It doesn’t price the implementation, check your margins, or tell you whether extra form submissions will become qualified leads.
Table of Contents
- When a Result Is Significant
- Framing Your Hypothesis Before the Test Starts
- What P-Values and Confidence Intervals Really Mean
- Sample Size and Power You Need Before Launch
- Why Significant Results Still May Not Be Worth Shipping
- Peeking, Multiple Metrics and False Winners
- Reading Real Test Results Without Fooling Yourself
- Sign Off the Test Plan Before Launch
When a Result Is Significant
A green winner badge should start a review, not end one. For a conventional test, check whether the p-value falls below the chosen significance threshold and whether the corresponding confidence interval excludes zero. Then make a separate business decision: is the improvement large enough to justify implementation?
A p-value is the probability of observing data at least this extreme if there were really no difference between the versions, assuming the test’s statistical assumptions hold. It isn’t the probability that your variant is a winner.
An analysis published on arXiv found that 7.6% of 552 experimental comparisons were statistically significant at the 5% level. That describes those comparisons, not a universal success rate, but it’s a useful reminder that teams shouldn’t expect every experiment to produce a decisive result.
How to Read a Test Result
The threshold below illustrates a conventional decision rule. These verdicts assume valid tracking, random assignment, and a completed testing plan.
| Result pattern | p-value | Verdict and next action |
|---|---|---|
| Clear lift, interval well above zero | Below the chosen threshold | Significant and potentially valuable; ship after checking revenue and costs |
| Significant but tiny lift | Below the chosen threshold | May be too small to repay the build cost; retain control unless the economics work |
| Flat result, interval spans zero | Above the chosen threshold | Inconclusive, not proof of no effect; complete the planned run or design a better-powered retest |
| Significant drop | Below the chosen threshold | Variant hurts the primary outcome; revert |
| One metric significant out of twenty | Below the threshold, uncorrected | Treat as a lead for a new test, not a winner |
Practical rule: Statistical significance describes evidence against no difference. Shipping requires evidence of enough value.
A flat result isn’t automatically a failed test. Its usefulness depends on which effects the interval still allows, and which it rules out.
Framing Your Hypothesis Before the Test Starts
Think of the null hypothesis like the presumption of innocence in a courtroom. You don’t begin by assuming the new design works; you require evidence strong enough to challenge the no-difference position. Unlike a verdict about guilt, however, failing to reject the null doesn’t establish that the versions are identical.
The courtroom analogy is a reminder to define your standard of evidence before examining the outcome.
Write the Decision Before Collecting Evidence
- Describe the change and expected mechanism. Moving the checkout action above the fold should help shoppers who currently miss it. Predict a purchase improvement, not merely more button visibility.
- State the null. Purchase conversion is the same for control and variant.
- Choose the alternative. A two-sided test asks whether the rates differ in either direction. A one-sided test asks about a prespecified direction; don’t switch after seeing a disappointing result.
- Name the primary metric. Use purchase conversion or qualified lead rate when that’s the outcome you need. Keep clicks as diagnostic information.
- Set the significance level and test direction. Record them in the experiment plan, rather than accepting whichever dashboard setting makes the result look strongest.
- Set power and the minimum detectable effect. Power describes the chance of detecting an effect of a specified size. Choose that size deliberately and distinguish it from your business break-even requirement.
Writing these choices down prevents a familiar negotiation: purchases didn’t improve, so the team promotes add-to-cart clicks to the main outcome. That changes the question after the evidence has arrived.
Copyable Hypothesis Card
| Field | Entry |
|---|---|
| Change | Move the checkout action above the fold |
| Expected mechanism | Reduce the effort required to begin checkout |
| Null and alternative | Equal purchase rates versus different purchase rates |
| Primary metric | Purchases per eligible randomized visitor |
| Statistical design | Chosen threshold, sidedness, power, and stopping method |
| Business requirement | Minimum contribution-profit improvement worth implementing |
| Safeguards | Refunds, checkout errors, and customer quality |
| Owner | Named person responsible for analysis and approval |
Keep the card with the implementation ticket. A test owner should be able to explain what would count as success before anyone sees a chart.
What P-Values and Confidence Intervals Really Mean
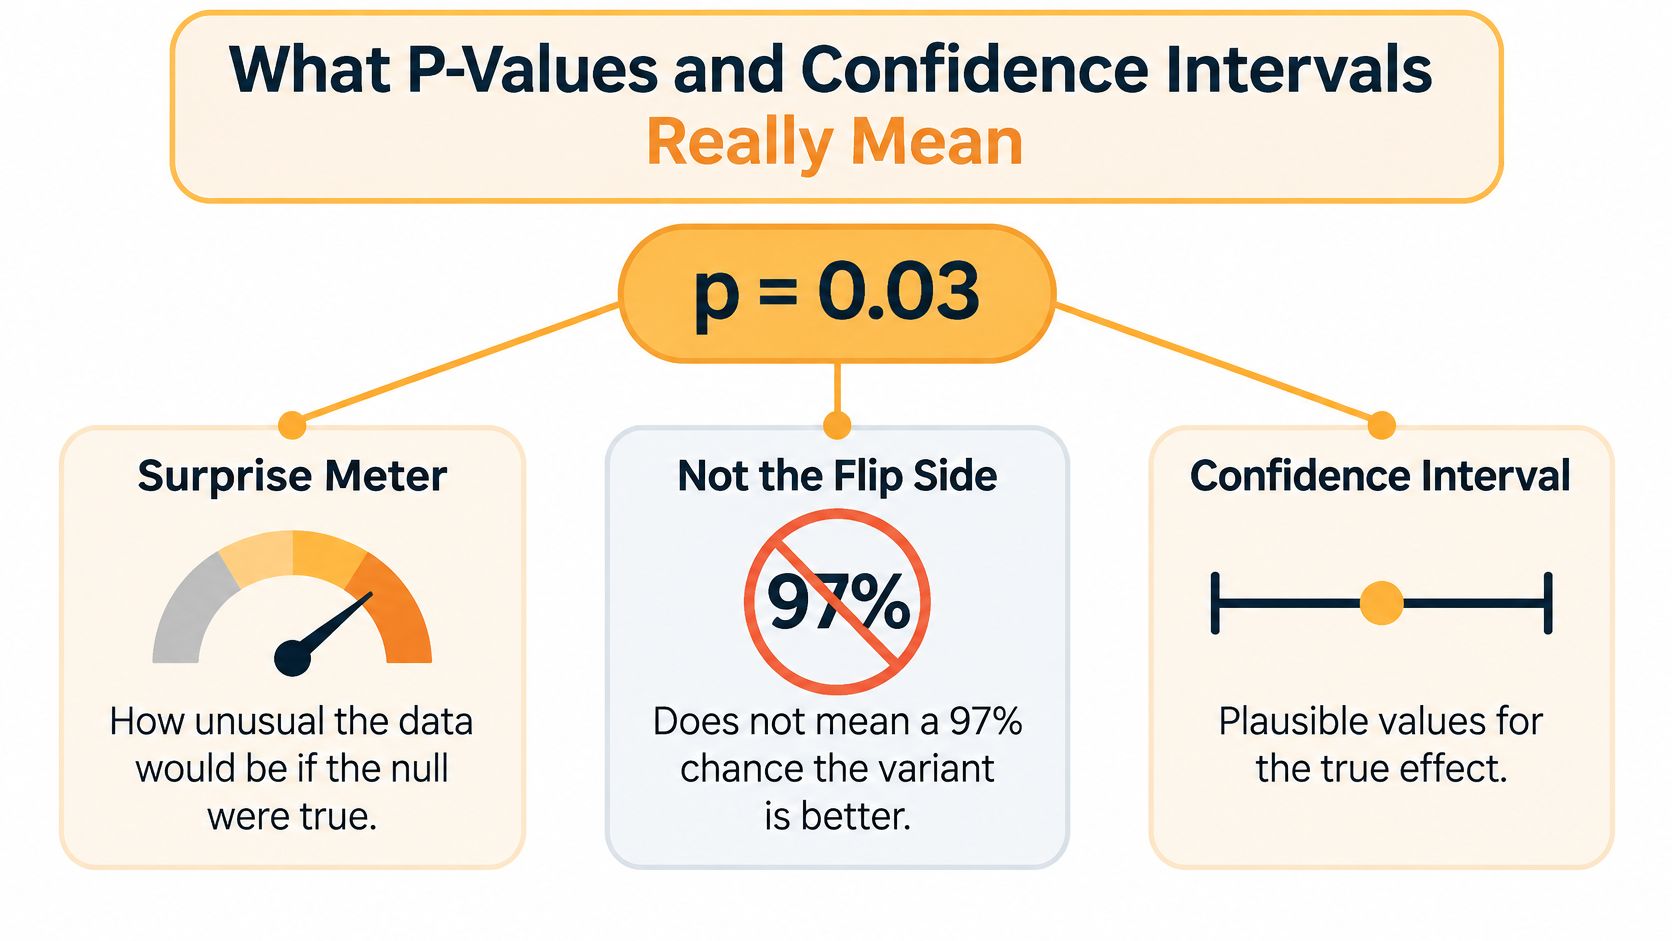
A small p-value doesn’t tell you the probability that the variant is better. It tells you how surprising the observations would be under the null hypothesis, using the selected statistical model.
Think of it as a surprise meter, not a winner-probability meter. A large sample can make a small difference look surprising under the null, even when that difference has little commercial value.
This concept map separates those interpretations.
Read the Range, Not Just the Estimate
A confidence interval adds information the p-value can’t provide alone: the size and uncertainty of the estimated effect. A weather forecast expressed as a range is more useful for planning than a single temperature. The same principle applies when you’re estimating conversion lift.
Consider a hypothetical dashboard showing a positive lift whose interval starts just above zero and extends to a much larger improvement. The result supports a positive effect, but the team still faces considerable uncertainty about its value.
Compare that with another hypothetical result showing the same estimated lift inside a narrow interval. If the whole interval clears your economic requirement, you have a stronger basis for committing development time and campaign budget.
| Dashboard element | Question it helps answer |
|---|---|
| Observed lift | How much better or worse did the variant perform in this sample? |
| Confidence interval | Which effect sizes remain reasonably compatible with the observations? |
| P-value | How incompatible are these observations with no difference? |
| Alpha | What significance threshold did we choose beforehand? |
| Sampling noise | How much could the estimate fluctuate across randomized samples? |
For a matching two-sided test and confidence level, an interval excluding zero corresponds to statistical significance at the associated alpha. That equivalence requires the same method, assumptions, and adjustments, not a p-value from one calculator and an interval from another.
Avoid the Probability Trap
In frequentist analysis, the confidence level describes the long-run coverage of the interval-building procedure. It doesn’t assign a probability to the fixed true effect lying inside this particular interval.
You can still describe the interval as a plausible range, provided you remember that it relies on the model and valid experiment execution. Broken purchase events won’t become trustworthy because the interval looks narrow.
Use this reporting sentence: The estimated conversion lift is X, the confidence interval runs from A to B, and P describes the probability of data this extreme or more extreme under no real difference.
Sample Size and Power You Need Before Launch
A conversion-rate sample-size calculation needs baseline conversion, minimum detectable effect, significance level, and power. It also needs a defined allocation and statistical method. Revenue per visitor requires a different calculation because order values vary, not just purchase outcomes.
Your minimum detectable effect, or MDE, is a planning input. It isn’t a guarantee that the test will detect that effect, nor a rule that smaller effects can never become significant.
An Illustrative Sample-Size Lookup
The following is a hypothetical planning calculation, not an observed traffic benchmark. It assumes equal allocation, independent visitor-level purchase outcomes, a two-sided test, 80% power, and 5% significance, using a standard normal approximation for two proportions; figures are rounded.
| Baseline conversion | Relative lift to detect | Approximate visitors per variant |
|---|---|---|
| 5% | 10% | 31,200 |
| 5% | 20% | 8,200 |
| 10% | 10% | 14,800 |
| 10% | 20% | 3,900 |
| 2% | 10% | 80,700 |
| 2% | 20% | 21,200 |
These illustrative calculations show the trade-off: smaller relative improvements require much more traffic. Lower baseline conversion also makes a given relative improvement harder to detect.
Relative lift isn’t percentage-point change. In the hypothetical first row, a 10% relative lift means moving from 5% conversion to 5.5%, not to 15%.
Turn the Lookup Into a Calendar Commitment
- Estimate the baseline from comparable traffic. Use a recent, representative period in Shopify Analytics or your analytics platform. Exclude known tracking outages and explain unusual promotions.
- Enter the smallest useful effect. Don’t pick an ambitious MDE to make the duration shorter.
- Calculate visitors per variant. Use your experimentation platform’s calculator so planning matches the eventual analysis.
- Divide by eligible daily traffic per variant. Total website sessions aren’t the denominator if only some visitors can enter the test.
- Allow complete business cycles and conversion maturation. Cover weekday and weekend behavior, then allow delayed purchases or lead qualification to resolve.
Set both the enrollment target and calendar constraints. If eligible traffic arrives more slowly than expected, the calendar date alone doesn’t make the experiment complete.
A test that can’t answer an economically useful question with available traffic needs a different design, not a more optimistic dashboard interpretation.
When the duration is impractical, test a more substantial change or use a higher-traffic journey. An earlier-funnel metric can help diagnose behavior, but it doesn’t remove the need to validate commercial outcomes.
Why Significant Results Still May Not Be Worth Shipping
Suppose a team improves add-to-cart activity and launches immediately. Purchases and revenue per visitor remain unchanged. The test may have answered its click question correctly while leaving the business question unanswered.
That limitation can persist even at substantial scale. An ACM-published community study ran eight high-powered experiments with a median of 2.4 million users per experiment, yet lacked sufficient power for key business outcomes within practical time horizons and relied on surrogate metrics.
Calculate What the Change Must Earn
Use incremental contribution profit, not order revenue alone, to assess payback. Include implementation costs and additional operating or media costs caused by the change. Don’t charge unchanged acquisition spending to the variant as though it were new expenditure.
Break-even relative lift = incremental cost to recover ÷ baseline contribution profit over the chosen payback period.
Consider this explicitly hypothetical redesign scenario:
| Assumption or calculation | Illustrative value |
|---|---|
| Monthly eligible visitors | 50,000 |
| Baseline purchase conversion | 2% |
| Monthly orders | 50,000 × 2% = 1,000 |
| Revenue per order | $60 |
| Gross margin, used here as a contribution-profit approximation | 40% |
| Baseline monthly profit | 1,000 × $60 × 40% = $24,000 |
| Redesign cost, with no incremental media cost | $4,000 |
| Relative lift needed for monthly payback | $4,000 ÷ $24,000 ≈ 16.7% |
| Profit from a hypothetical 2% relative lift | $24,000 × 2% = $480 monthly |
| Simple payback at that lift | $4,000 ÷ $480 ≈ 8.3 months |
This calculation assumes stable traffic, order value, margin, and conversion quality. If the variant increases discounts, returns, fulfillment expense, or acquisition spending, recalculate using those changes.
Validate the Metric That Pays
For ecommerce, inspect revenue per visitor and contribution profit per visitor, not purchase conversion alone. For professional services, connect submissions to qualified opportunities and eventual customer value. Customer acquisition cost and lifetime value help expose improvements that look attractive at the form but disappoint after qualification or retention.
Proxy metrics are useful when they explain a mechanism or guide the next experiment. Validate their relationship with revenue through a downstream test or randomized holdout, rather than assuming more clicks imply more profit. That’s also the right lens for Shopify conversion optimization: follow the customer through the purchase, not just the product-page interaction.
For a conservative launch decision, require the entire interval to clear break-even, not merely its upper end. An interval crossing break-even leaves the investment case unresolved.
Peeking, Multiple Metrics and False Winners
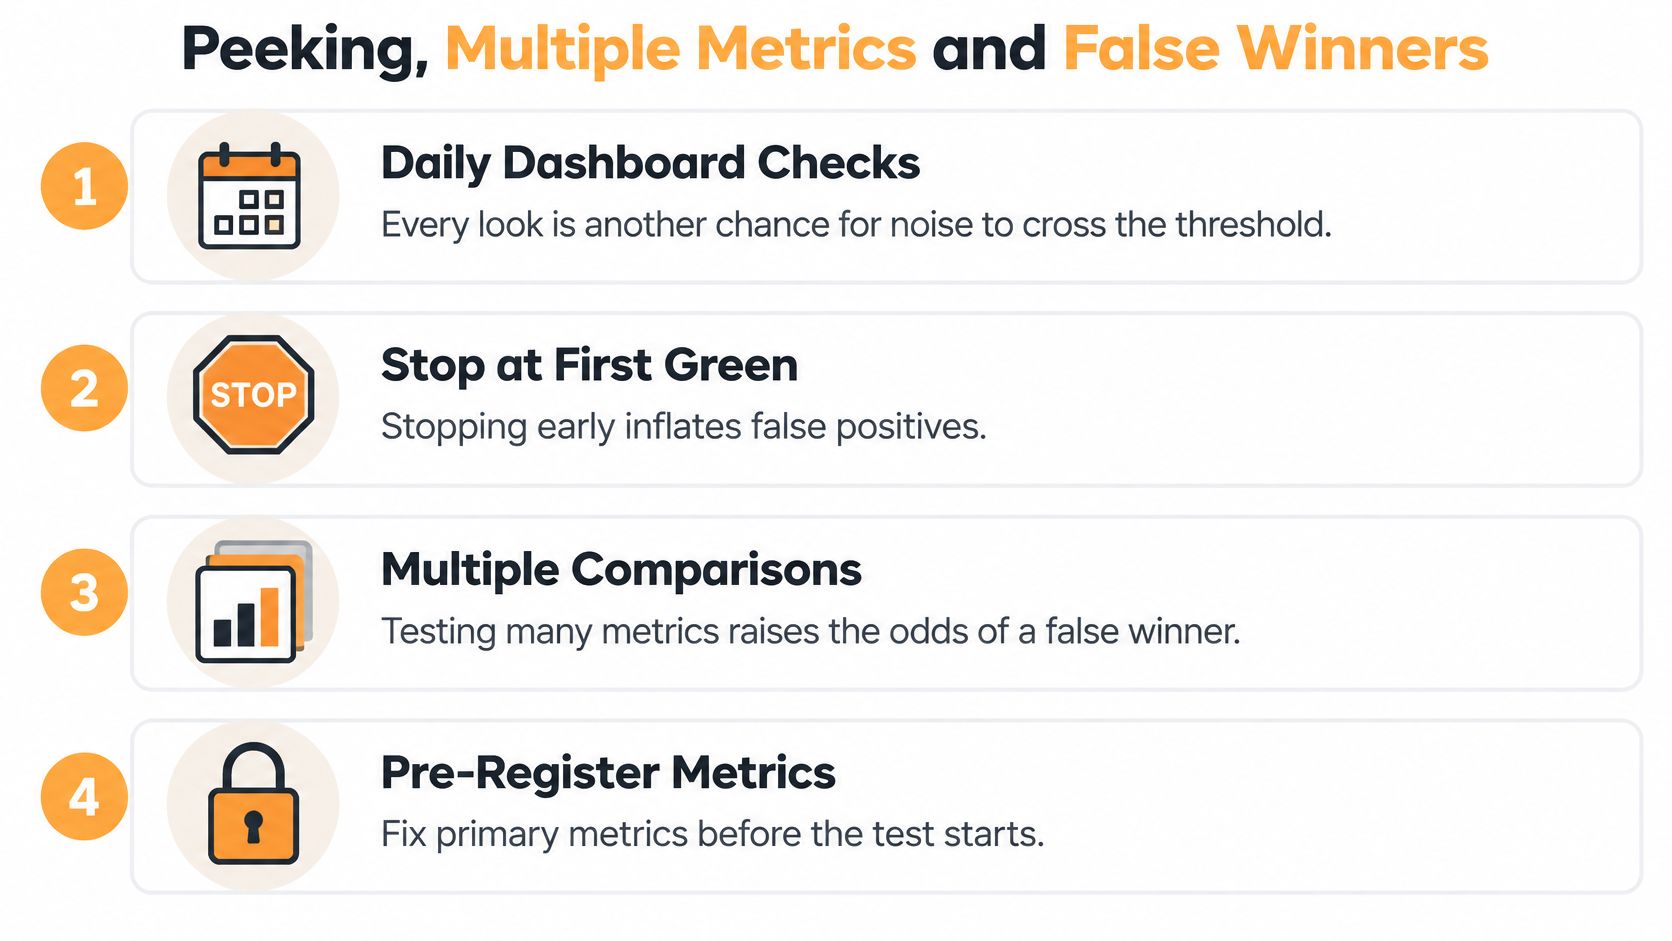
Checking a dashboard daily isn’t wrong in itself. Stopping a conventional fixed-horizon test the moment it looks significant is the problem. You’ve made the stopping decision depend on a favorable fluctuation without accounting for that selection in the analysis.
You can monitor checkout failures, traffic allocation, and tracking health while a test runs. Separate those operational checks from permission to announce a winner.
This checklist visual highlights the habits that turn routine monitoring into selective reporting.
More Opportunities to Find a Favorable Result
The same selection problem appears when teams search across metrics. GrowthBook’s experimentation guidance describes how testing 20 metrics at a 5% threshold can produce roughly a 64% probability of at least one apparently significant result when all null hypotheses are true, under the independent-comparison calculation.
Marketing outcomes are often correlated, so that example isn’t a universal probability for every dashboard. The operational lesson still holds: a team that selects whichever metric looks best hasn’t preserved its original error control.
Bonferroni correction controls the probability of any false rejection across a defined family of comparisons by tightening the individual thresholds. That protection costs power, making genuine effects harder to identify with the same traffic.
For continuous decision-making, use a platform that explicitly supports sequential testing or always-valid p-values. Those methods account for permitted monitoring under their design assumptions. They aren’t a label you can attach after stopping an ordinary test early.
Choose the Rule That Matches the Workflow
- Declare the primary decision metric. Keep diagnostic outcomes visible without letting them replace it after results arrive.
- Record the stopping rule and MDE. State whether decisions occur at a fixed horizon or through a supported sequential design.
- Label segmentation as exploratory. Device, audience, and creative breakdowns can suggest a follow-up test.
- Address multiplicity. Define which variants and outcomes belong to the confirmatory comparison family.
- Use the right discovery control. False-discovery-rate methods can suit exploratory collections of hypotheses, but they answer a different error-control question from family-wise protection.
These practices prevent the selective framing illustrated by examples of misleading statistics. A chart can contain accurate measurements and still support the wrong conclusion when the team hides how it selected them.
A winner discovered through unplanned peeking is a hypothesis to validate, not a result to quietly relabel as confirmatory.
Reading Real Test Results Without Fooling Yourself
Say a manager opens a landing-page test after several days and sees a small positive lift with a significant dashboard badge. The manager wants to send all paid traffic to the new page before a campaign refresh. The analyst’s job is to establish whether that badge answers the planned question.
Start with enrollment and timing. Did the experiment reach its planned sample, and have exposed visitors had time to convert? A short run isn’t automatically invalid, but a calendar milestone doesn’t substitute for a completed design.
Review the Evidence in Order
- Inspect the interval. Determine whether the result rules out commercially inadequate effects, not just a negative effect.
- Verify the original outcome. Check that purchase conversion was the declared metric rather than the best-looking result selected afterward.
- Audit monitoring decisions. Ask whether anyone stopped enrollment because the dashboard first turned green.
- Trace the paying outcome. Check order values, refunds, and revenue per visitor before interpreting the conversion gain as growth.
A high-powered replication summarized by Emergent Mind reported conversion-rate lifts of 0.16%, 0.29%, and 0.73% across three A/B tests, none statistically significant at the 5% level. Positive estimates alone didn’t establish positive effects.
That doesn’t prove those underlying effects were real but too small to detect. It means the observations didn’t cross the stated evidence threshold. Small real effects can require substantial samples, but noise can also produce small positive estimates.
Write a Decision Record, Not a Celebration
| Report field | What the analyst records |
|---|---|
| Observed lift | Estimate with relative or absolute units stated |
| Interval | Lower and upper bounds using the declared method |
| Sample | Eligible randomized visitors in each arm |
| Primary metric | Exact event definition and denominator |
| Validity checks | Tracking, allocation, attribution, and stopping review |
| Decision | Ship, retain control, revert, or run a new experiment |
If the review uncovers missing purchase events, fix measurement before collecting another result. An end-to-end review of conversion tracking in Google Analytics helps teams distinguish a customer-behavior change from an instrumentation change.
If the small lift remains worth pursuing, design a fresh test sized for it and validate revenue per visitor. If the completed interval already excludes an economically worthwhile improvement, retaining control is a useful decision, not an embarrassment.
Sign Off the Test Plan Before Launch
Use this go-or-no-go checklist in the launch meeting. An unresolved item needs an owner and a resolution before enrollment begins.
The Approval Gate
- Economics recorded. The primary outcome connects to revenue, margin, or qualified leads, with a defined payback period and break-even requirement.
- Enrollment and timing approved. The sample calculation matches the statistical method, eligible traffic, calendar constraints, and conversion window.
- Tracking verified end to end. Test order values, refunds, lead status, and CRM stages. Plan a randomized holdout where practical; a before-and-after revenue comparison alone can’t isolate the rollout’s effect.
- Outcome rules signed. Ship when the interval clears the economic requirement. Revert for demonstrated harm, retain control when worthwhile value is ruled out, and consider a properly planned retest when uncertainty spans break-even.
- Reporting ready. Store the hypothesis card and decision-record template with the implementation ticket.
At Excellorix, our monthly reporting is tied to revenue outcomes and covers revenue growth, customer acquisition cost, ROAS, conversion rate, average order value, and customer retention rate. That keeps test decisions connected to business performance rather than an isolated winner badge.
A test is only as good as the plan written before it began. Lock the plan, then launch.
Excellorix offers conversion optimization, A/B testing, and analytics implementation to connect experiment results with revenue outcomes. Visit Excellorix to discuss your funnel, tracking setup, and next test, including which improvement would be worth shipping.