Skip to content



Roughly 7 in 10 shopping carts do not become orders, and the Baymard Institute cart abandonment list puts the average cart-abandonment rate at 70.19%. That number shouldn’t send you straight to a checkout redesign. It should send you to your own funnel, by device and traffic source, to find where your store loses revenue. Shopify conversion optimization works when you name one leak, fund one fix, and keep it only if revenue per session, margin, refunds, and repeat purchase hold.
Table of Contents
- Measure the Funnel and Name the Leak
- Product Page Changes That Lift Add to Cart
- Merchandise the Collection and the Cart
- Checkout Fixes Ranked by Abandonment Cause
- Speed Work Tied to Revenue Not Lab Scores
- Run Tests and Fund the Highest-Payback Leak
Measure the Funnel and Name the Leak
A single storewide conversion rate tells you that something is wrong. It doesn’t tell you what to fix, who it affects, or what the fix is worth. The Shopify Behavior reports calculate conversion at each stage by dividing sessions reaching that stage by total sessions, including store visits, cart creation, checkout initiation, and purchase completion. Keep those stages separate, because the same overall rate can hide weak product-page engagement, low add-to-cart activity, payment friction, or checkout abandonment.
Benchmarks give you context. They don’t set your quota. A store selling replenishment skincare to returning email subscribers shouldn’t judge itself against a cold paid-traffic furniture store, and neither should use a blended average to hide a mobile problem.
Shopify conversion benchmarks and device abandonment
| Measure | Figure | When | Source context |
|---|---|---|---|
| Average ecommerce conversion | 1.95% | March 2024 | IRP Commerce via Shopify |
| Average Shopify store | 1.4% | 2023 | Littledata benchmark of 2,800 stores |
| Average mobile ecommerce conversion | 2.89% | June 2024 | Shopify |
| Shopify versus other platforms | about 15% higher | 2023 | Shopify study with a consulting firm |
| Mobile cart abandonment | 85.65% | 2015, still cited | Barilliance via Shopify |
| Tablet cart abandonment | 80.74% | 2015, still cited | Barilliance via Shopify |
| Desktop cart abandonment | 73.07% | 2015, still cited | Barilliance via Shopify |
The device rows matter more than most operators admit. Shopify cites Barilliance’s 2015 research showing cart-abandonment rates of 85.65% on mobile, 80.74% on tablets, and 73.07% on desktop. Those figures are old, so don’t treat them as your current baseline. Use them as a warning that a healthy desktop rate can conceal a serious mobile leak in the blended store average.
Six steps that rank one leak
- Export the last 30 days: Pull visits, product views, cart creation, checkout initiation, and purchases. Note the theme version, major apps, promotions, price changes, and paid campaigns live during that period, because you’ll otherwise compare two different stores.
- Segment before you interpret: Split by device, traffic source, country, landing page, product, and new versus returning visitor. Don’t mix paid mobile sessions from a broad prospecting campaign with returning desktop sessions from email.
- Calculate the stage rates: Work out product-view to cart, cart to checkout, and checkout to purchase for each major segment. This marks the point where Shopify conversion optimization stops being a list of generic tactics and becomes a diagnosis.
- Rank by revenue at risk: Multiply lost sessions at each stage by average order value. A small percentage gap on your highest-traffic mobile product template can be worth more than a dramatic gap on a page with little qualified traffic.
- Write one specific hypothesis: Name the audience, page, friction, and expected commercial result. For example, say new paid mobile visitors don’t add to cart because delivery cost only appears in checkout, so moving the shipping threshold beside the price should raise add-to-cart without lowering average order value.
- Set the decision rule before launch: Define the minimum sample, test period, primary metric, and guardrails. Judge completed orders, revenue per session, and the mobile gap, and discount results distorted by a sale weekend, weekday mix, or a sudden change in traffic source.
Fix the earlier stage when two leaks look similar. There’s no point polishing checkout for shoppers who never reach it because the product page failed to earn a cart.
Keep the diagnostic view in one place. A marketing analytics dashboard helps you compare device, source, and funnel stage without rebuilding the same spreadsheet each week. If you want a practical walkthrough of themes, apps, and page-level tactics, you can improve your Shopify conversion rate with that detailed guide from Yassine Malti. Use it after you’ve ranked the leak, not as a substitute for ranking it.
I would start with the segment where intent is already proven and value is leaking, usually mobile product traffic or checkout starters. Broad homepage traffic looks large, but it often contains more low-intent sessions. Your first funded fix should be attached to buyers who were already close to spending money.
Product Page Changes That Lift Add to Cart
Don’t redesign the product page unless product-view to cart is your largest revenue leak. On mobile, put the price, selected variant, and a persistent add-to-cart control in the first screen, and keep the control visible while the shopper reads details below. The shopper shouldn’t have to scroll back up or hunt for the button after checking size, ingredients, or delivery information.
The mobile buy box below shows the core principle. Price, product, and purchase action need to stay connected.
Answer the main doubt first
Lead the gallery with the image that resolves the biggest purchase objection, not the prettiest studio shot. Apparel needs scale and fit on a body. Beauty products need texture, shade, or application. Furniture needs the item in a room so shoppers can judge proportions. If the first image doesn’t answer the main doubt, the sticky button only helps people leave faster.
Put the shipping threshold, delivery window, and return window beside the price. A shopper who discovers an unexpected delivery charge at checkout experiences that as a price increase, not useful information. Variant names should match the photo exactly, and a sold-out combination should be blocked immediately rather than failing after the shopper presses add to cart.
Say you sell a premium chair. The shopper needs dimensions, assembly effort, fabric care, delivery access, and returns handling for a bulky item. Put reviews and a short specification block below the fold, where considered buyers will read them. A short badge can’t replace fit, ingredients, compatibility, weight limits, or care instructions.
This short walkthrough is useful for checking how product details, calls to action, and mobile layout work together.
Match paid traffic to the promise
For a paid landing product, the hero image, headline, price, and default variant must match the advertisement. If an ad sells a waterproof trail shoe and the page opens on a lifestyle colorway with the waterproof claim buried below reviews, the session becomes a bounce in disguise. Make the default variant the product you can fulfill profitably and actually want to sell, not the cheapest loss-leader.
Don’t launch a quiz, bundle widget, review app, and new buy box in the same release. You won’t know which change caused the result, and the extra scripts may create a second problem. After the change, compare add-to-cart rate and revenue per session for that template on mobile and desktop, split by paid and organic traffic.
Practical rule: A higher button click rate with flat revenue per session means the page got busier, not better.
I would keep a product-page change only when more qualified sessions reach checkout or purchase at a stable order value. If add-to-cart rises but checkout completion falls, the page may be overselling, hiding costs, or pushing the wrong variant.
Merchandise the Collection and the Cart
Use collection and cart work when your ranked leak is browse to product or cart to checkout, not when product-view to cart is the problem. These pages decide whether shoppers find a relevant product and whether the cart feels worth completing. Treat them as merchandising surfaces, not containers for whatever your theme sorts automatically.
Sort the collection for sellable margin
- Lead with fulfillable products: On the collection paid traffic lands on, put in-stock variants you can deliver at full margin near the top. Don’t let out-of-stock sizes, discontinued colors, or low-margin clearance products consume the first screen.
- Sort by commercial value: Use sell-through and margin together rather than defaulting to newest or cheapest. The cheapest SKU may attract clicks and still drag down order value and contribution.
- Match the tile to the promise: Collection images, names, prices, and badges should reflect the ad, email, or search intent that brought the shopper there. If the campaign promises waterproof shoes, the first tiles shouldn’t be fashion trainers with a filter three taps away.
- Make filters do real work: Size, fit, compatibility, material, price, and availability should narrow the choice quickly. Remove filter values that lead to empty results, because a dead end reads like a broken store.
A collection page succeeds when more sessions reach a relevant product, not when shoppers apply more filters or view more pages. Track product clicks, product-view to cart, and revenue per collection session by landing source.
Reveal the full deal in the cart
Show the shipping threshold, delivery window, and return window before the checkout button. Surprise cost is too common a reason for abandonment to leave the answer for the payment step. If free shipping starts at a threshold, state how far the current cart is from it and what shipping costs below that threshold.
Add one relevant unit that can raise average order value, such as the correct refill, replacement part, care product, or size-specific accessory. Don’t turn the cart into a second catalog. A crowded cart drawer with unrelated bundles, a quiz, and three discount prompts gives the shopper more decisions at the moment they were ready to pay.
Keep guest checkout visible from the cart. Account creation can be offered after purchase, when it no longer blocks revenue. Make quantity changes, variant corrections, and item removal obvious on a phone, and confirm that discount-code errors explain what went wrong.
A fuller cart with a lower checkout rate points to the offer or cost reveal, not the product grid.
Compare cart-to-checkout rate and revenue per session on mobile and desktop, split by paid and organic traffic. If average order value rises but fewer carts start checkout, your add-on may be useful and still too aggressive. If checkout starts rise while order value falls sharply, you may have trained shoppers to wait for a cart discount. Keep the version that improves revenue per session without pushing refund-prone or low-margin orders.
Checkout Fixes Ranked by Abandonment Cause
Treat checkout as a diagnosis, not a default instruction to make the form shorter. The Baymard Institute checkout usability research reports an average cart-abandonment rate of 70.19%, based on 272 moderated usability test sessions, more than 850 benchmarked checkout steps, and nine quantitative studies involving 11,777 participants. It also estimates that the average large ecommerce site could achieve a 35.26% relative increase in conversion through checkout-design improvements alone. Treat that as evidence of commercial headroom, not a promised Shopify uplift.
Rank the cause before choosing the fix. Extra costs, forced accounts, payment distrust, and form complexity need different interventions, and testing all of them together hides the answer.
Checkout abandonment causes and the first fix
| Friction | Evidence | First test |
|---|---|---|
| Extra costs such as shipping, tax, or fees | 48% of U.S. shoppers | Show threshold, tax or delivery estimate, and returns before payment |
| Forced account creation | 24% | Make guest checkout the prominent path |
| Low trust in payment handling | 18% | Show wallets and the payment processor beside the pay button |
| Checkout too long or complicated | 17% | Cut nonessential fields from 23.48 toward 12 to 14 |
| Checkout design on a large site | 35.26% relative conversion potential | One material change, measured as orders per checkout start |
The funnel view below keeps that order clear. Cost surprise comes before field count.
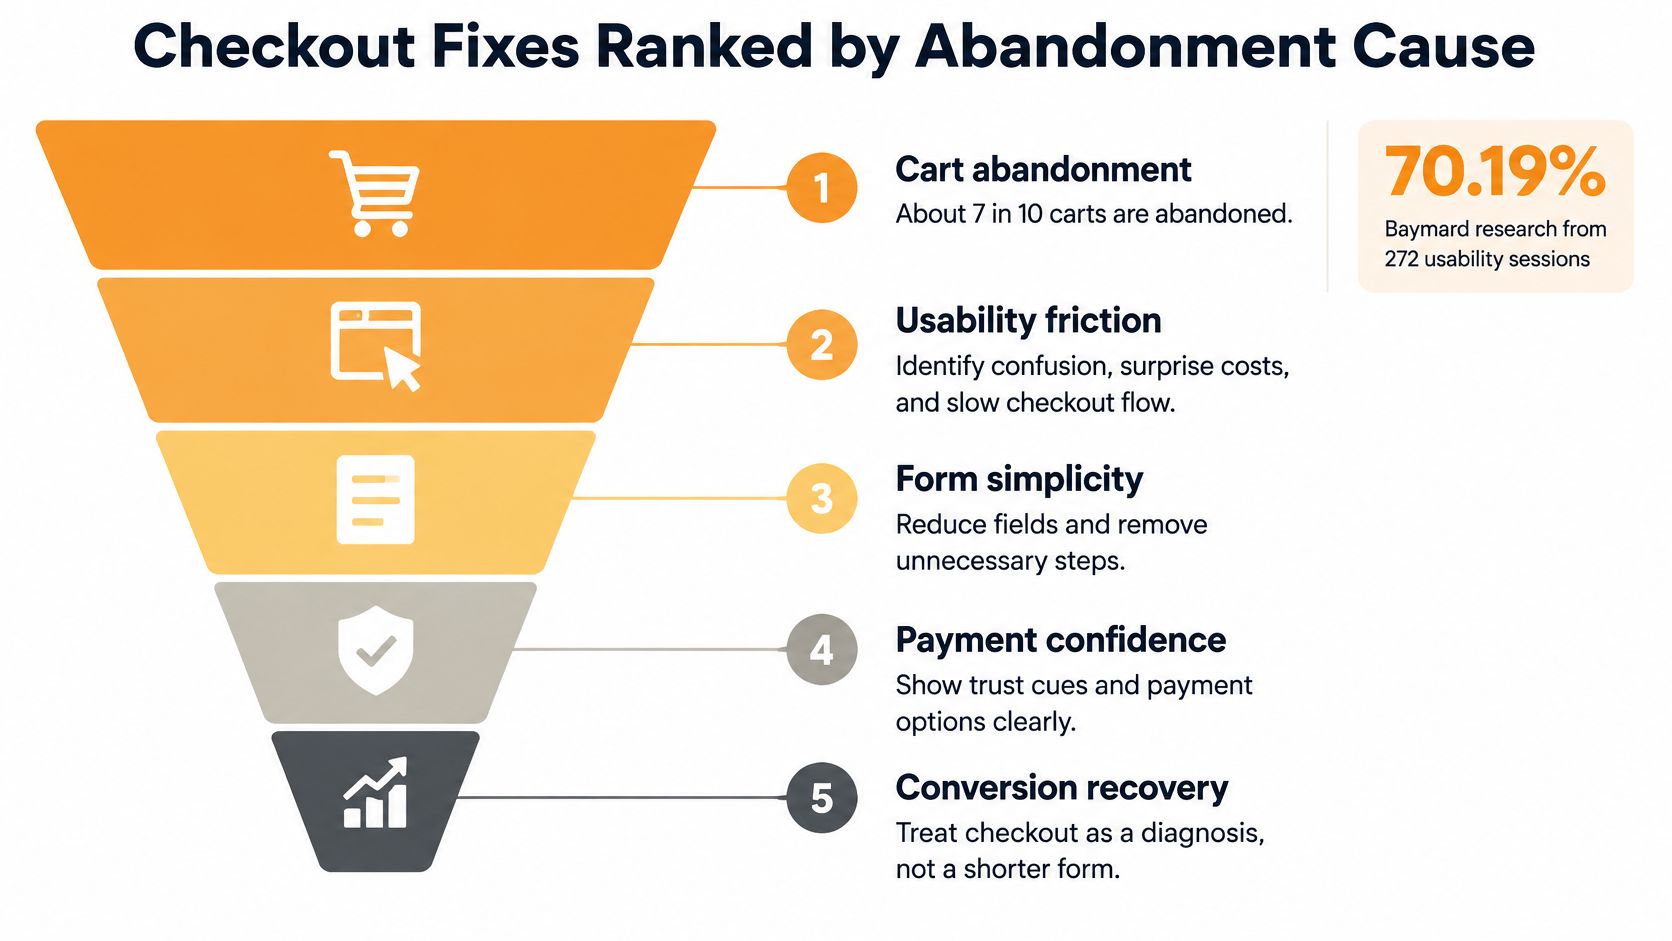
Match the test to the abandonment signal
If support tickets and checkout drop-off cluster around shipping, show the shipping threshold, tax or delivery estimate, and return terms before payment. A second Baymard cut puts slow delivery behind a meaningful share of abandonment, so a delivery estimate on the cart can be a better first test than removing fields. Our ecommerce checkout optimization guide goes deeper on mapping those signals to specific fixes. If shoppers stop at account creation, make guest checkout the obvious path and move registration after the order.
If payment trust is the issue, surface relevant accelerated wallets and make clear who processes the card. Don’t scatter generic badges across the page and call that trust. The shopper needs to recognize the payment route, understand the total, and know what happens if the order goes wrong.
If the form itself is the leak, remove nonessential fields and fix address, discount, inventory, and payment-error states. Baymard found the average U.S. checkout contains 23.48 default form elements, while an ideal checkout can be reduced to approximately 12 to 14 form elements. Error messages should identify the field, explain the correction, and preserve everything the shopper already entered.
For a broader operational view of recovery messages, payment options, and post-abandonment follow-up, CartBoss explains ways to improve checkout conversion rates without relying only on discounts.
Know when shorter is wrong
High-consideration products can need delivery access details, financing terms, installation choices, prescription checks, or returns information before payment. Don’t strip that content just to hit a field target. A checkout that produces more unsuitable orders, cancellations, support contacts, or refunds hasn’t improved the business.
Measure orders per initiated checkout, revenue per session, payment-error rate, and the mobile versus desktop gap. Stop or revise the change if the lift comes mostly from discounted or high-refund orders. I would rather keep a slightly longer checkout that produces profitable, low-refund orders than celebrate a higher completion rate that operations pays for later.
Speed Work Tied to Revenue Not Lab Scores
Speed is an input to the leak you’ve already ranked. It isn’t a separate hygiene project judged by a synthetic score in isolation. Baseline real-user performance for mobile and desktop, then prioritize the slowest templates that carry revenue, usually collection, product, cart, and paid landing pages.
Google’s mobile page speed industry benchmarks found that when load time increased from one second to ten seconds, the probability of a mobile visitor bouncing increased 123%. The same analysis reported that increasing page elements from 400 to 6,000 was associated with a 95% decline in conversion probability. Those figures don’t mean every script is harmful. They mean page weight needs a commercial justification.
Work the slowest revenue template first
- Compress and size imagery correctly: Product images should be no larger than the layout needs, with modern formats served where the theme and browsers support them. A huge desktop image on mobile wastes the shopper’s connection before the offer appears.
- Audit apps and tags: Remove unused app scripts and duplicate pixels, and defer noncritical JavaScript. List what each remaining script earns, whether that’s reviews, fit guidance, subscriptions, or measurement.
- Lazy-load below-the-fold media: Don’t make the first product image compete with a full review gallery, recommendation rail, and video that most shoppers never reach. Keep the primary purchase path interactive first.
- Check layout shift and blocked interaction: A page that visibly jumps or ignores taps while widgets load feels broken even if a lab score improves. Test the actual buy flow on a mid-range phone.
Retest after every app, theme, tracking, or tag deployment. One new review widget, chat tool, or personalization script can erase months of cleanup. A disciplined Shopify speed optimization service should report template-level changes and commercial effects, not just before-and-after scores.
A faster page that removes reviews, delivery copy, or merchandising logic qualified buyers needed is not a conversion win.
Split results by speed cohort, device, and paid versus organic traffic. Aggregate averages can conceal mobile losses, and paid landing sessions often have less patience than branded search visitors. Tie each change to add-to-cart rate, checkout initiation, purchase rate, average order value, and revenue per visitor.
Keep trust and offer-clarity elements when your diagnosed leak is trust or unclear costs. Removing them for speed solves the wrong problem. If the lab score rises while revenue per session falls, roll back the script cut or restore the element in a lighter implementation. I would take a slightly slower page that earns profitable orders over a fast template that strips out the information shoppers need to commit.
Run Tests and Fund the Highest-Payback Leak
Change one material thing at a time, keep a stable control, and pre-commit the sample and stop date. Shopify conversion optimization fails when teams call a winner on clicks, add-to-cart activity, or a short promotional weekend. A variant can convert more discount hunters, raise the headline conversion rate, and still worsen contribution margin and CAC payback.
The testing sequence below keeps the decision rule ahead of the result.
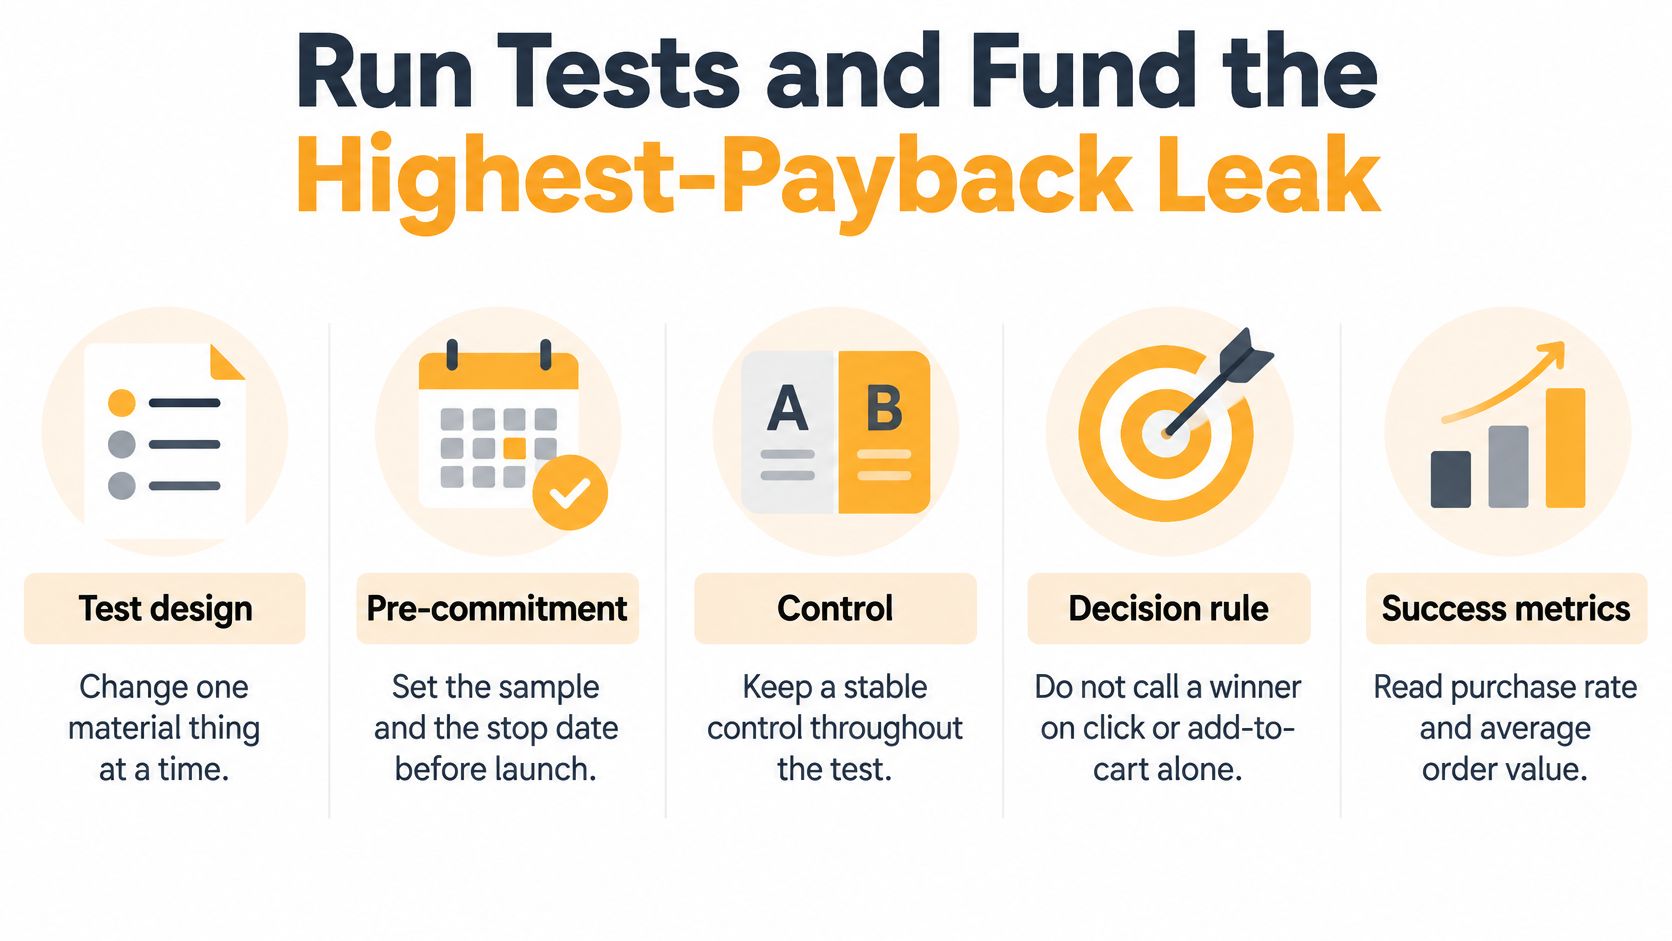
Judge the cohort, not just the click
Read purchase rate, average order value, revenue per session, contribution margin, refund rate, cancellations, and support contacts together. Then track the cohort against LTV and CAC through repeat purchase. That tells you whether the change bought durable customers or rented one discounted order.
Fund the stage where lost sessions multiplied by average order value is largest, on the device and traffic source that already show buying intent. Ship the mobile product buy box if product-view to cart leaks the most value. Fix one abandonment cause if checkout is the constraint. Clean up images and duplicate app scripts when slow revenue templates are suppressing every downstream stage.
Put AI behind a holdout
Shopify’s guide to using AI says AI can identify product pages with views but few add-to-carts, analyze cart activity, and help test copy, images, layouts, and offers. It also warns that customer data may leave the merchant’s control and that businesses should review retention, model-training, and third-party-access practices. Don’t skip that review because a tool promises automated lift.
Compare three approaches on the same metrics: rules-based merchandising, a controlled experiment, and an AI recommendation, each against a stable holdout. Document the approved data and model inputs, require human review of recommendations, and monitor segment-level harm. Never target inferred health or other sensitive attributes, and use the least customer data that can do the job.
Less personalization can beat more personalization when traffic is thin, behavior is noisy, or the catalog is already complex.
AI is especially easy to overcredit when it learns who responds to coupons. Add-to-cart may rise while margin, repeat purchase, and customer lifetime value fall. Park AI personalization until you can maintain a holdout and measure incremental revenue rather than activity.
Excellorix reports proven results including a 30% increase in ecommerce revenue, a 10% lower customer acquisition cost, and a 20% higher conversion rate. Those outcomes still shouldn’t replace your own holdout. Keep any change only if revenue per session holds after margin, refunds, cancellations, and a first read of repeat purchase. I would fund the highest-payback leak this month and let lower-value ideas wait, even if they’re easier to launch.
Start with a free ecommerce audit from Excellorix, covering your acquisition channels, conversion performance, retention setup, and store experience, so you can see the biggest revenue opportunities and what a growth plan would look like. Bring your device, source, and funnel-stage data, and we’ll help you rank the leak worth funding first instead of spreading effort across random page tweaks.