
A marketing analytics dashboard should act as a measurement-control system for CAC, LTV, and ROAS, not just a visual report layer. Its job is to connect authoritative events, expose data quality, and support decisions about incremental revenue, not merely display channel-reported conversions.
The usual failure starts on Monday morning. Google Ads shows conversions, Meta reports attributed purchases, Shopify records revenue, and the CRM contains leads that haven’t become customers yet. Each platform looks healthy in isolation, but nobody can answer which campaigns created new demand, whether acquisition cost is sustainable, or whether reported ROAS reflects genuine commercial impact.
A useful dashboard brings those questions into one operating view. It connects spend, impressions, clicks, leads, conversions, revenue, refunds, customer behavior, and retention signals, then shows how much confidence the team should place in each metric.
Table of Contents
- Why Your Marketing Analytics Dashboard Needs to Be an Operating System
- Selecting High-Signal KPIs and Mapping Data Sources
- Implementing Tracking Across Platforms and Campaigns
- Transforming Data and Moving Beyond Last-Click ROAS
- Dashboard Templates for CAC, LTV, and Full-Funnel Measurement
- Visualizing Best Practices and Data Confidence
- Conclusion and Next Steps for Growth Teams
Why Your Marketing Analytics Dashboard Needs to Be an Operating System
A dashboard that only summarizes last week’s performance is a polished archive. A dashboard that tells a growth team what changed, why the change matters, how reliable the underlying data is, and what decision to make next becomes part of the operating system for revenue.
Marketing measurement has moved from fragmented reporting toward integrated decision systems. Earlier marketing analysis often depended on surveys, aggregated sales data, and laborious reconciliation with advertising and competitor information, as described in this UCLA review of marketing-analysis methods. Modern dashboards reduce that manual separation by bringing campaign costs, impressions, clicks, leads, conversions, revenue, and customer data into a continuously updated view.
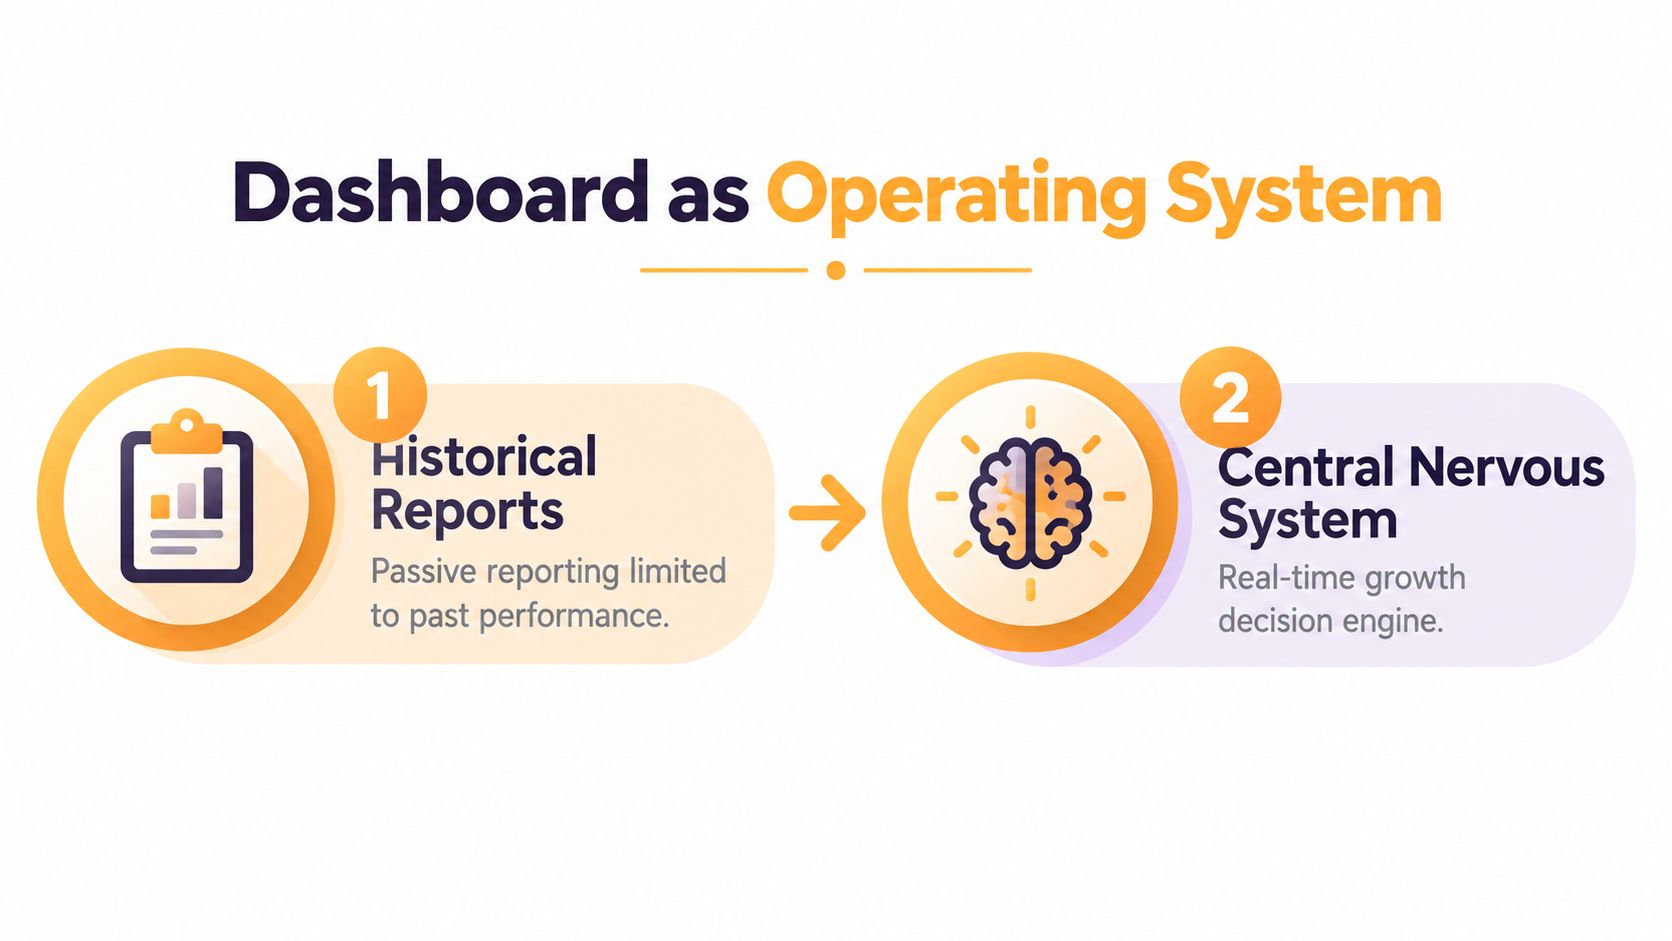
Consider a Shopify brand running paid search, paid social, email, and organic content. A channel report might show that retargeting generated efficient conversions. A revenue dashboard can add refund status, new-versus-returning customers, margin, and customer value. That broader view may change the budget conversation entirely, even before the team runs a controlled incrementality test.
Operating principle: A dashboard should make the next accountable action easier, not make the previous reporting cycle look more attractive.
From charts to commercial control
Google’s acquisition of Urchin Software in 2005 and the later launch of Google Analytics as a free public web-measurement service lowered the cost barrier to tracking visits, referrers, page performance, and basic funnel behavior, as documented in this history of Google Analytics. That milestone helped establish the expectation that marketing performance should be measured quantitatively.
The hard part now isn’t access to charts. It’s creating common definitions across platforms. A professional-services firm may need to connect an ad click to a form submission, qualified opportunity, signed contract, and recognized revenue. A DTC brand may need to connect an ad impression to a purchase, refund, repeat order, and customer lifetime value. The dashboard becomes valuable when those events share a consistent logic.
What the operating system must answer
A revenue-oriented dashboard should help the team answer four questions:
- What happened? Show traffic, engagement, conversions, spend, revenue, and retention by channel.
- Can we trust it? Display freshness, missing campaign identity, duplicate events, unmatched spend, and reconciliation gaps.
- What caused it? Separate observed attribution from modeled or experimentally validated incremental impact.
- What should change? Tie every recommendation to a baseline, an expected outcome, uncertainty, and a follow-up test.
That structure prevents a common mistake: treating precise platform attribution as proof of causal impact. A clean visualization can’t repair weak definitions or incomplete tracking.
Selecting High-Signal KPIs and Mapping Data Sources
Start with the commercial outcome, not the available chart. If the business needs profitable customer acquisition, define the outcome as incremental revenue, qualified leads, CAC, LTV, or contribution margin, then identify the events and systems that can support each measure.
Build the KPI map first
Use a simple KPI register before choosing a visualization tool:
| Business question | Primary KPI | Authoritative events or records |
|---|---|---|
| Are we acquiring customers efficiently? | CAC | Ad cost, qualified acquisition, customer record |
| Are leads commercially useful? | Cost per qualified lead | Form submission, lead qualification, CRM stage |
| Does acquisition create durable value? | LTV | Customer identity, orders, refunds, repeat purchases |
| Are campaigns profitable? | ROAS and contribution margin | Spend, net revenue, product or service margin |
| Are reported results causal? | Incremental revenue | Holdout, geo-test, lift study, or modeled estimate |
The source of truth should match the event. Purchase and refund records generally belong to the ecommerce or finance system. Lead qualification belongs in the CRM. Advertising cost comes from the relevant media platform or governed spend table. Analytics platforms can provide behavioral context, but they shouldn’t automatically become the authority for every commercial outcome.
For a DTC account, separate gross revenue, net revenue, refunded revenue, and modeled revenue. For professional services, distinguish an inquiry from a qualified lead, an opportunity, a signed engagement, and collected revenue. If the dashboard collapses those stages into one conversion count, it will encourage the wrong optimization.
Give every campaign one identity
Campaign naming is a governance problem, not a cosmetic preference. Create a documented taxonomy covering source, medium, campaign, audience, creative, market, and landing page. Apply it consistently across paid search, paid social, email, affiliates, partnerships, and offline activity.
Use standardized UTM parameters, platform auto-tagging, cross-domain configuration, and a fallback process for manually tagged links. Google Analytics identifies missing campaign parameters, privacy restrictions, processing delays, and implementation errors as common causes of “(not set)” dimensions, and its guidance recommends auto-tagging, account linking, and manual UTM tagging as controls. See the Google Analytics guidance on missing campaign data.
A naming taxonomy should also define ownership. Someone must approve new campaign values, maintain the lookup table, and resolve unmapped records. Otherwise, the dashboard slowly develops separate versions of “paid social,” “social paid,” and “Meta,” which makes comparison unreliable.
Practical rule: If two teams can name the same campaign differently, the dashboard doesn’t yet have a governed measurement model.
Keep vanity metrics in context
Impressions, clicks, and engagement can diagnose delivery and creative response. They shouldn’t sit at the top of a revenue view without a connection to qualified outcomes. Put diagnostic metrics beside the funnel stage they help explain, then reserve executive space for outcomes the business can act on.
Implementing Tracking Across Platforms and Campaigns
Tracking architecture should follow the customer journey, from the first identifiable campaign interaction to the commercial event that matters. The aim isn’t to collect every possible signal. It’s to preserve campaign identity and event continuity while respecting consent and platform limitations.
Audit the path from click to outcome
Begin with a live test for each important channel and conversion path:
- Open a tagged link. Confirm that source, medium, campaign, content, and term values persist as intended.
- Check landing-page capture. Verify that the analytics platform receives the campaign dimensions and that redirects don’t strip them.
- Test cross-domain behavior. If a form, booking tool, payment provider, or checkout sits on another domain, confirm that the session remains connected.
- Trigger the conversion. Test purchases, qualified lead events, calls, bookings, and other primary actions.
- Reconcile the destination system. Confirm that the event reaches Shopify, the CRM, finance, or the relevant operational database.
- Inspect processing and latency. A dashboard should show when the event occurred, when it arrived, and when it became available for reporting.
Auto-tagging reduces manual error for supported advertising platforms. UTMs remain important for channels where auto-tagging isn’t available, including email, partner links, social posts, and offline campaigns. Keep the taxonomy in a shared document or reference table, not in individual campaign managers’ memory.
Find the gaps before building charts
Look for missing source and medium values, duplicate transactions, unmatched spend, broken referral exclusions, inconsistent currencies, and conversions that arrive without a customer or lead identifier. Review consent coverage and privacy-related signal loss as part of the audit, because a technically correct event can still represent only a portion of eligible activity.
For a paid media program, the PPC management service from Excellorix is one example of a workflow that connects campaign management with reporting around cost per lead, cost per acquisition, ROAS, and conversion rates. The broader lesson is to define the measurement contract before handing reporting to a platform or agency.
Put controls beside performance
A mature dashboard doesn’t hide implementation warnings on a separate technical page. Place indicators near the relevant metric:
- Event coverage: How consistently purchase or qualified-lead events arrive.
- Identity match: Whether customer and lead records join across systems.
- Attribution completeness: How much spend has usable campaign identity.
- Duplicate rate: Whether repeated events inflate conversion counts.
- Revenue reconciliation: Whether analytics, ecommerce, CRM, and finance totals agree.
- Event latency: Whether recent activity is complete enough for a decision.
For unexplained reconciliation gaps above 2–5%, investigate the difference between analytics, ad platforms, and finance or ecommerce systems, using a tolerance appropriate to the business model and transaction volume. The range is a practical operating threshold from the verified measurement guidance, not a universal pass mark.
Transforming Data and Moving Beyond Last-Click ROAS
Last-click ROAS answers a narrow question: which recorded interaction received credit under a chosen attribution rule? It doesn’t answer whether the campaign created revenue that wouldn’t have happened without it.
That distinction matters for branded search, retargeting, email, repeat customers, and other environments where users may already be close to converting. Platform-reported ROAS can remain useful for diagnostics, pacing, and creative comparisons. It becomes unsafe when the team treats it as a direct measure of incremental profit.
Add the variables that explain demand
A marketing-mix or allocation model should include more than media inputs. Build a weekly panel at the finest practical level for the business, such as region, channel, campaign, device, and product category. Include spend, impressions, reach, clicks, conversions, revenue, promotions, price, distribution, seasonality, and relevant operational variables.
Transformations should reflect how marketing behaves:
- Adstock: Capture delayed effects rather than assuming all impact occurs immediately.
- Saturation curves: Represent diminishing returns as spend increases.
- Standardization or logarithmic inputs: Make variables more comparable when their scales differ.
- Missingness and outliers: Record the treatment instead of deleting unusual observations.
Nielsen’s analysis of 19 Japanese marketing-mix studies found regional-level models more accurate and reliable than national models because regional data provides more observations and variation. The same analysis reported that excluding non-media drivers increased explanatory error by 102% and forecasting error by 80%, as shown in its marketing-mix modeling best-practices report. Those findings support a dashboard that displays modeled estimates with uncertainty instead of presenting a single unquestionable ROAS number.
Compare attribution with controlled evidence
Use attribution as a diagnostic layer, then compare it with evidence from:
- Geo-holdouts: Keep comparable regions untreated or treated differently.
- Platform lift tests: Use the platform’s controlled testing framework where appropriate.
- Conversion-lift studies: Compare exposed and control groups.
- Marketing-mix modeling: Estimate contribution across channels and external demand factors.
Label each output clearly as observed, modeled, or experimentally validated. Add confidence intervals or credibility ranges where the method supports them. A recommendation should state the baseline, estimated incremental return, uncertainty, test design, minimum detectable effect, and post-test decision rule.
Nielsen reported that models excluding non-media business drivers inflated incremental volume by 47% and ROI by 68%. That evidence explains why a dashboard can look rigorous while still producing systematically unsafe budget recommendations. Clicks aren’t a substitute for lift either. In a study covering 12 major brands, 1.5 billion Facebook impressions, 600 million Google search impressions, and $2 billion in sales, Nielsen found delivered impressions more predictive of sales lift than clicks, while click-through rates were often below 1%.
The practical standard is simple: don’t ask only which channel received credit. Ask how much revenue would have occurred without the campaign.
Dashboard Templates for CAC, LTV, and Full-Funnel Measurement
A useful template starts with a decision and expands only as far as needed to support it. The executive view should be compact. The diagnostic views should let the team move from a revenue outcome to the campaign, audience, product, region, device, or funnel step that explains it.
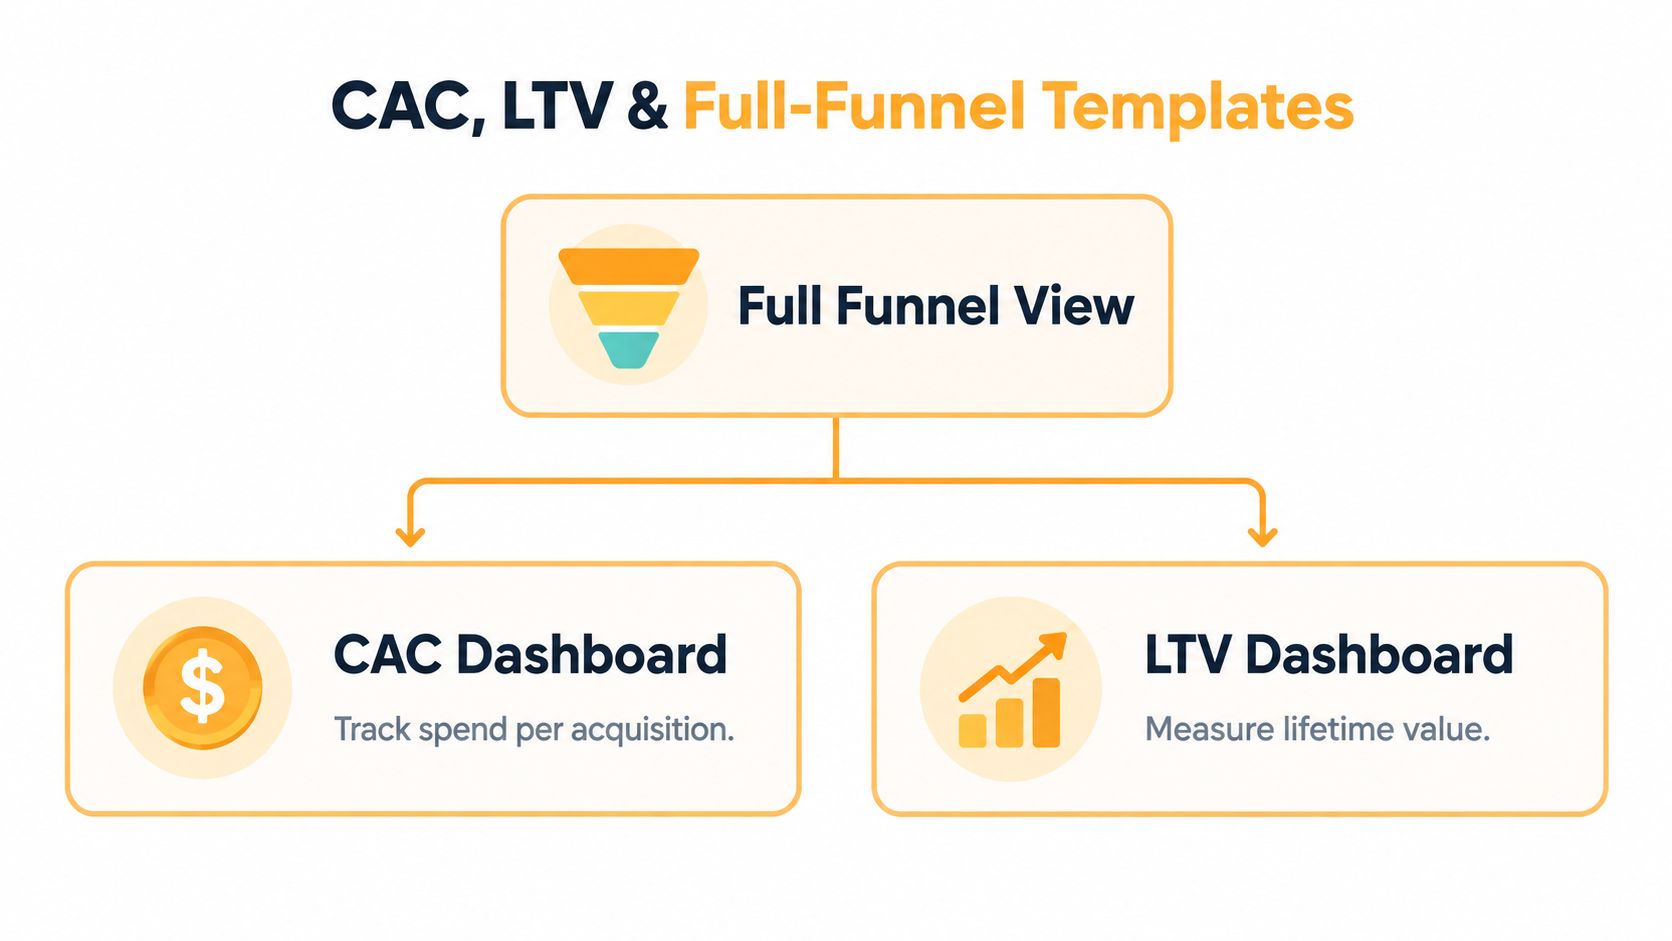
Full-funnel view
Place acquisition metrics at the top, conversion metrics in the middle, and commercial and retention outcomes at the bottom. A DTC view might connect traffic and engagement to conversion rate, CAC, net revenue, refunds, repeat purchases, LTV, and contribution margin. A professional-services view should connect traffic and form activity to qualified leads, opportunities, signed work, collected revenue, and acquisition cost.
Use filters for region, channel, campaign, device, and product category, but don’t make every filter available on the opening screen. The first view should identify a material change. Drill-downs should explain it.
CAC dashboard
The CAC page should show spend alongside the acquisition definition. Keep new customers separate from leads, and qualified leads separate from all form fills. Add channel, campaign, landing page, audience, and time filters so the team can distinguish media efficiency from funnel quality.
A rising CAC isn’t automatically a media problem. It may reflect lower landing-page conversion, weaker lead qualification, pricing changes, a promotion ending, or a tracking gap. Place those diagnostic measures close enough to the CAC metric that the team can investigate without exporting another report.
LTV dashboard
LTV needs customer identity and cohort logic. Segment by acquisition source, first product or service, customer type, and purchase or engagement behavior. For subscription or repeat-purchase businesses, separate observed value from modeled future value. Include refunds and cancellations so the dashboard doesn’t reward acquisition that produces revenue but weak customer economics.
For Shopify brands, Excellorix’s Shopify marketing strategy services represent one implementation option for connecting ecommerce growth activity with broader measurement and conversion work.
This short video provides a visual prompt for thinking about dashboard structure and metric hierarchy:
The template should make trade-offs visible. A channel with lower reported ROAS might create stronger incremental demand, while a channel with high attributed ROAS might mainly harvest existing intent. Put both measures in the same decision workflow, with their methodology labeled.
Visualizing Best Practices and Data Confidence
A dashboard earns trust by showing uncertainty and data condition, not by hiding them behind clean colors. Executives need a quick answer, but they also need to know whether the answer is complete, current, comparable, and suitable for action.
A 2025 survey of 200 CMOs across the US, UK, Germany, Austria, and Switzerland found that executives estimated 45% of data used for marketing decisions was incomplete, inaccurate, or outdated, while 30% said improving data quality would have the greatest effect on performance, according to this marketing data quality report. Those figures make data confidence a dashboard feature, not an analyst footnote.
Design for decisions
Use a visual hierarchy that reflects the decision cycle:
- Top layer: Revenue, incremental revenue where available, CAC, LTV, contribution margin, and ROAS.
- Diagnostic layer: Conversion rate, qualified-lead rate, spend, reach, clicks, and funnel progression.
- Control layer: Freshness, event coverage, identity match, consent coverage, missing UTMs, duplicates, and reconciliation status.
Use line charts for trends, tables for campaign comparisons, and restrained color for exceptions. Don’t use red and green as decoration. A red value should indicate a defined condition that requires investigation.
The same report found that 66% of marketers worry about tracking users across channels and 57% fear third-party-cookie loss will reduce attribution effectiveness. Privacy-safe first-party data can improve visibility, but only when teams govern definitions, joins, consent, and offline conversion imports consistently.
For practical guidance on avoiding misleading interpretations, review these examples of misleading statistics. The point isn’t to distrust every metric. It’s to show the conditions under which a metric deserves confidence.
Data-confidence standard: Every important number should carry a source, freshness status, definition, and known limitation.
A dashboard should also distinguish net, gross, refunded, observed, and modeled revenue. That label can prevent a budget decision based on a number that looks precise but doesn’t represent the business outcome the team intended to measure.
Conclusion and Next Steps for Growth Teams
A marketing analytics dashboard becomes strategic when it connects business definitions, reliable events, campaign identity, data-quality controls, and causal measurement. The implementation path is practical: define CAC, LTV, ROAS, and qualified outcomes; map each KPI to an authoritative source; standardize campaign tracking; reconcile systems; label attribution methods; and attach confidence indicators to the numbers used in budget decisions.
The strongest dashboards don’t promise certainty where none exists. They show what happened, what may have caused it, how complete the data is, and what test should determine the next move. That creates an accountable measurement culture across DTC, ecommerce, professional services, healthcare, manufacturing, and startup teams.
Excellorix helps organizations connect marketing analytics, conversion tracking, paid media, SEO, websites, and ecommerce activity into revenue-focused reporting workflows. Visit Excellorix to discuss a dashboard and measurement system built around the decisions your growth team needs to make.