Skip to content



A store owner watches paid-ad clicks climb, but orders barely move. The instinct is to buy more traffic or add a discount. Before doing either, find out whether shoppers can load the pages, understand the offer, and complete checkout, and whether they’re ready to buy at all.
To increase ecommerce conversion rate without sacrificing margin, connect each change to revenue per visitor and the shopper’s likely intent. A checkout fix may help people ready to purchase. A comparison guide or saved cart may serve browsers better. The work starts with locating the leak, then choosing a response that fits.
Table of Contents
- Find the Revenue Leaks in Your Funnel
- Speed Up the Pages That Earn Money
- Turn Product Pages Into Buying Decisions
- Remove Checkout Friction Without Cutting Trust
- Match Offers to Where Visitors Are in Their Buying Journey
- Testing Changes Without Fooling Yourself
- Choosing Between Your Team and an Agency Partner
Find the Revenue Leaks in Your Funnel
More clicks and flat orders don’t tell you where the problem is. Build a funnel in GA4, Shopify analytics, or your analytics platform that follows sessions through product views, add-to-cart, checkout started, and purchase. Track revenue per session alongside the number of visitors reaching each step, so you can see not just where people leave, but which losses matter commercially.
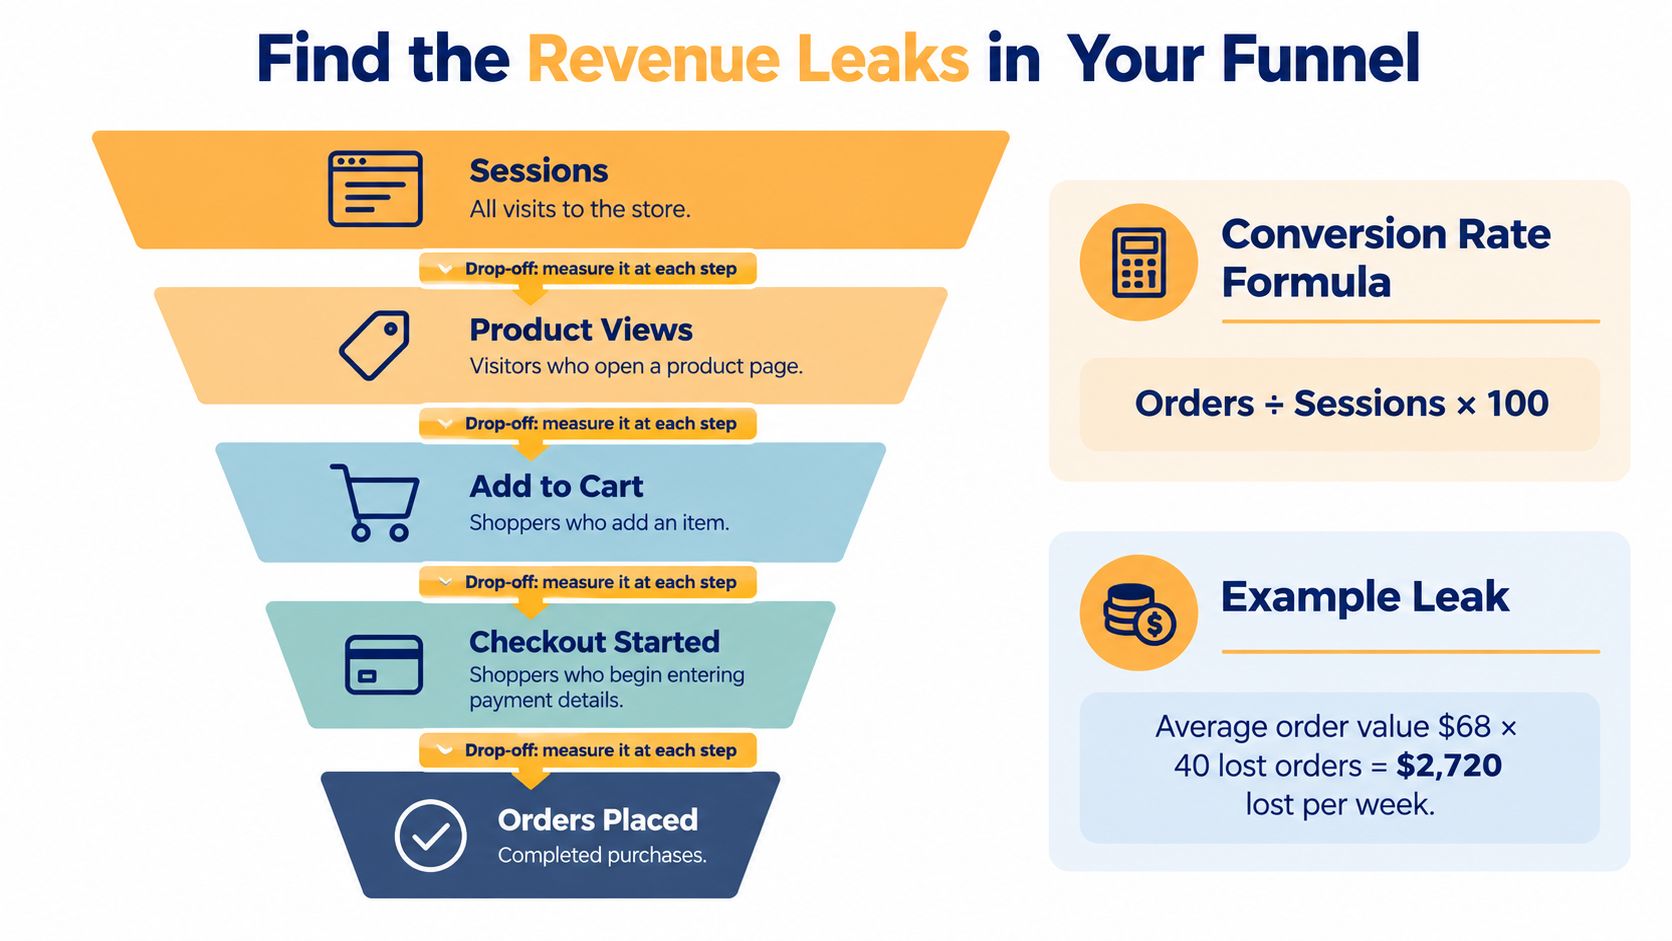
A site-wide conversion rate can hide the useful detail. Consider an illustrative fashion-store scenario: ad clicks rise while orders stay flat, and the overall rate looks much the same. Segmenting the funnel by device and landing page may reveal that mobile shoppers who land on the homepage stopped adding items to their cart after a banner change. That pattern gives the team a specific place to investigate, rather than a reason to redesign the entire store.
Break the funnel into useful segments
Start with a consistent path and event definitions. Check that a product view means the same thing across reports, and that checkout starts and purchases aren’t duplicated or missing. Then compare the path by device, traffic source, landing page, and new versus returning visitor. If tracking is fragmented, fix that before treating a dashboard as evidence. An ecommerce marketing analytics dashboard can help teams bring funnel activity and revenue measures into a more usable view.
For each stage, ask a concrete question. Do visitors reach product pages but fail to add to cart? Do carts turn into checkout starts, but not completed orders? Does the pattern appear on mobile, on a particular landing page, or for paid traffic specifically? Those distinctions help separate a page problem from a measurement problem or an audience mismatch.
Choose what to investigate first
Prioritize possible fixes with a simple score: estimated revenue lift × confidence ÷ effort. Treat the score as a sorting aid, not proof. A checkout issue affecting many shoppers may deserve attention before a copy tweak on a low-traffic page, but confirm the underlying behavior before committing development time.
Leave the audit with two or three specific leaks to investigate. For each one, write down the segment, the suspected cause, and the metric that would show progress, such as add-to-cart rate for mobile product-page visitors or completed orders per checkout start. That makes the next decision testable.
Speed Up the Pages That Earn Money
A slow page can lose a shopper before the product or offer gets a fair chance. Google’s Mobile Site Speed Playbook reports that 53% of users leave a mobile site when a page takes longer than three seconds to load. The same playbook cites SOASTA research linking pages that load one second faster with conversion-rate increases of up to 27%. Treat that lift as a hypothesis to test on your store, not a promise.
Start with real shopper conditions
Use PageSpeed Insights to inspect page opportunities and Core Web Vitals, but don’t make a lab score your only measure of success. Compare it with real-user performance data available through your analytics or monitoring tools. Field data reflects how actual shoppers experience the site across devices and connections. Google’s review of retail sites across European countries found even the best-performing retail sites averaged 3.8 seconds, slower than the two-second benchmark discussed in its playbook.
Prioritize templates that contribute directly to revenue: product pages, category pages, and the cart. Check whether mobile shoppers encounter slow image loading or delayed interactions on those pages, then connect performance changes to engagement and purchase outcomes.
Fix the heaviest problems first
Begin with product imagery. Resize images to the dimensions the page needs, compress them, and serve modern formats where supported. Oversized assets can add weight without improving the shopper’s view of the product.
Next, review Shopify apps and third-party scripts. Remove apps the store no longer uses, and consider deferring tracking or marketing scripts that aren’t needed for the first page render. Ask the developer to check code delivery, hosting, and CDN setup if page performance remains poor after asset cleanup.
Practical rule: Make one meaningful performance change at a time, then compare the affected pages with a suitable control. Faster loading matters when it improves the buying experience, and the store’s own conversion data should confirm the commercial effect.
Record mobile load performance alongside product engagement and revenue per visitor. If speed improves but shopping behavior doesn’t, investigate the offer and page usability instead of continuing to optimize a score in isolation.
Turn Product Pages Into Buying Decisions
A shopper opens a product page on a phone. They want to know the price, whether the right size or color is available, and when the item might arrive. If those details are buried, or a variant selection shifts the page around, uncertainty gets in the way of a confident choice.
Start with the first screen. Keep the product name, price, available variants, stock status, and add-to-cart action easy to find. If delivery timing depends on location, explain how shoppers can get an estimate rather than implying an exact promise the store can’t support.
Answer objections as shoppers encounter them
A shopper who can’t judge color, scale, or fit needs more than a single product shot. Use a gallery that supports close inspection and shows the item in context. A size guide should be easy to reach from the size selector, not hidden in a footer.
Place useful review snippets near the purchase action, where they can help answer doubts at the decision point. A short FAQ can handle practical concerns about fit, returns, care, or compatibility. Keep answers specific. Generic reassurance doesn’t resolve a shopper’s actual question.
On mobile, a sticky add-to-cart bar can keep the purchase action available while someone reads product details. Make sure it doesn’t cover images, selectors, or important information, and check how it behaves when a shopper changes variants. A feature intended to reduce scrolling can become another obstacle if it obscures the choice being made.
Don’t leave a dead end
An out-of-stock product page shouldn’t force the shopper to start over. Offer relevant alternatives, a back-in-stock alert, or both. Likewise, don’t wait until checkout to reveal shipping costs or key delivery constraints. Shoppers may interpret late-arriving costs as a change in the deal, rather than a detail they had merely not yet seen.
Test changes against a clear primary metric. For a clearer variant selector, measure add-to-cart activity on the affected product pages. For better stock alternatives, examine whether visitors continue into another product and complete an order. Track revenue per visitor as a broader check, so a rise in clicks doesn’t look like a win if completed purchases or order value move in the wrong direction.
Remove Checkout Friction Without Cutting Trust
Baymard Institute reports a global average cart-abandonment rate of approximately 70.19%, and its benchmark found that an average U.S. checkout displays 23.48 form elements by default. Its usability testing indicates an effective checkout can be reduced to roughly 12–14 elements. In the United States, 17% of online shoppers said they had abandoned an order in the previous quarter because checkout was too long or complicated, according to Baymard’s checkout usability research.
Those findings support a shorter, clearer checkout. They don’t mean every field should disappear. A shopper still needs to understand what information the store requires and why.
Remove friction, not useful context
Offer guest checkout so account creation doesn’t block an order. Use browser autofill, sensible defaults, and field validation that explains how to fix an error. Show the full cost, including shipping and tax where available, before the payment step. Offer familiar payment methods such as Apple Pay, Google Pay, PayPal, or Shop Pay when they fit the store’s customers and setup.
Baymard’s checkout UX research identifies solvable checkout usability problems and estimates that large ecommerce sites could achieve about a 35% conversion-rate increase by addressing them. That estimate isn’t a forecast for every store. Use it as a reason to inspect the full purchase path, not just the final payment screen.
Keep required fields understandable
A field can create friction even when it’s necessary. For example, a phone number request may feel intrusive if the checkout doesn’t explain that a carrier could need it for delivery. Explain requirements briefly beside the relevant field, and don’t ask for information the order doesn’t need.
Run this checklist on desktop and mobile:
- Shorten the form: Keep only the fields needed to process and deliver the order.
- Offer guest checkout: Let shoppers complete a purchase without creating an account.
- Show the total early: Make delivery costs and applicable taxes visible before payment.
- Support familiar payments: Display relevant options near the payment choice.
- Make errors recoverable: Identify the field that needs attention and preserve the information already entered.
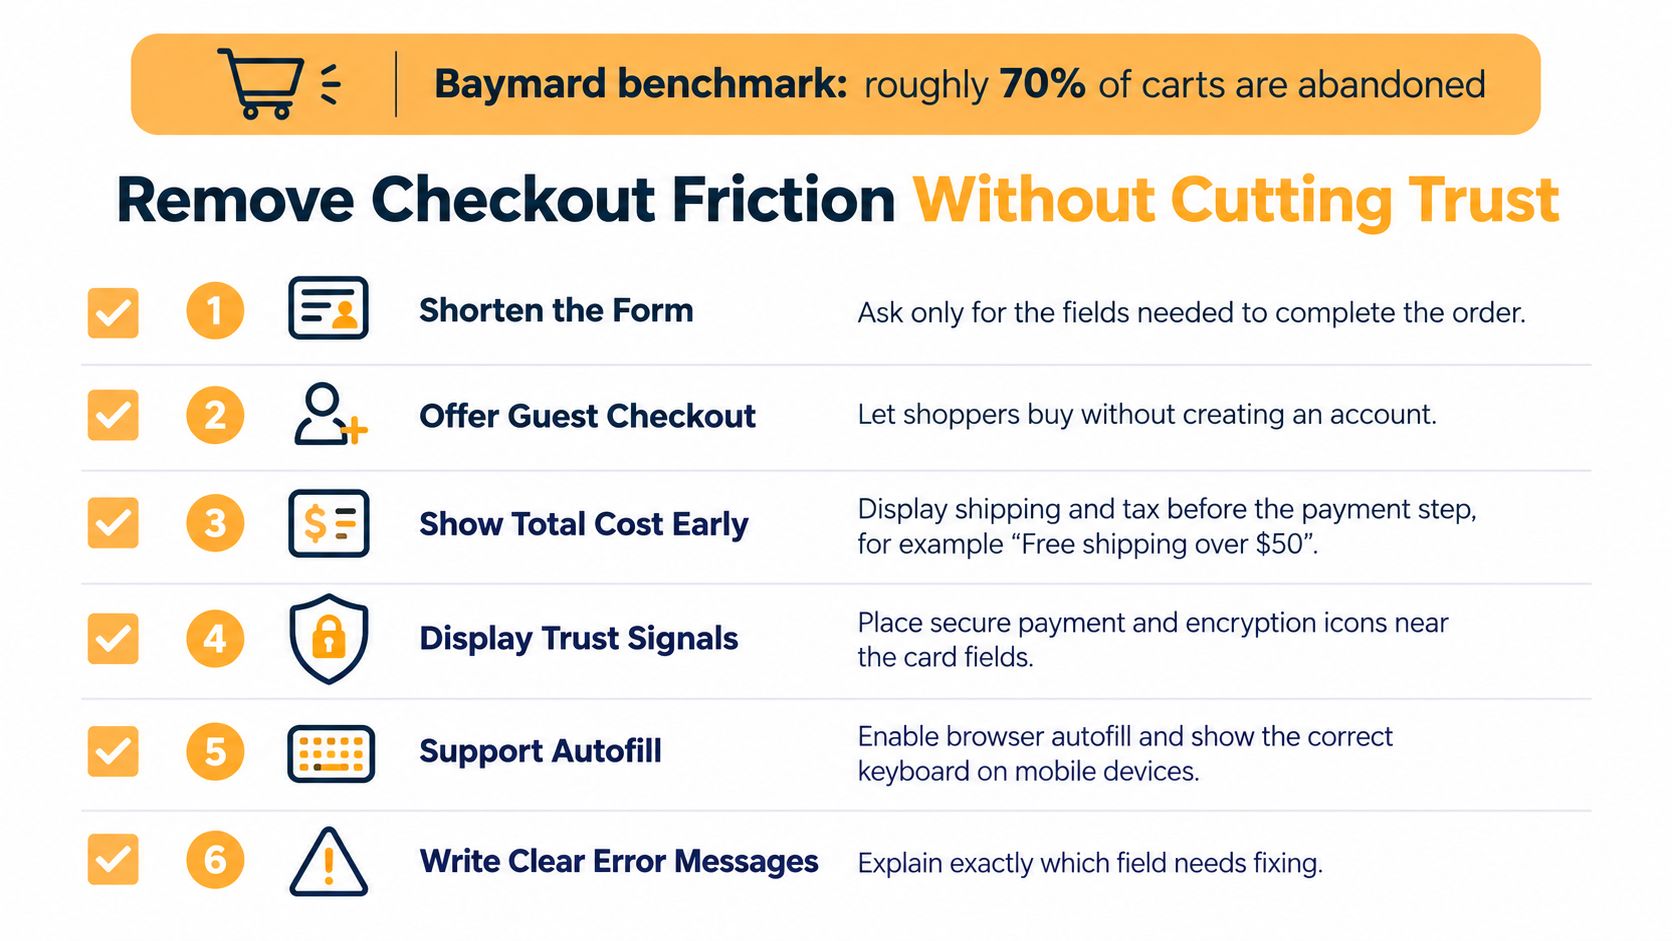
A checkout can look clean and still fail if delivery fees appear late, a mobile field is hard to use, or an error clears the shopper’s entries. Review the full flow, including delivery information and payment recovery. For a more detailed process, use this ecommerce checkout optimization guide.
Match Offers to Where Visitors Are in Their Buying Journey
Not every visit is a near-sale. Cart-abandonment research notes that many shoppers leave because they’re browsing or aren’t ready to buy, while 18% of surveyed U.S. online shoppers said they abandoned because they didn’t want to create an account, according to research on cart-abandonment reasons. Removing account friction can help a purchase-ready visitor. It won’t make every browser ready to order.
Segment by signals that help you choose an appropriate next step: new or returning visitor, paid or organic source, product-view depth, device, and geography. These are clues, not definitive labels. Use them to shape an experience, then watch how the segment responds.
Offer the next useful action
A shopper comparing similar products may benefit more from a comparison tool or size finder than a discount. Someone close to ordering needs clear delivery estimates and an easy path through checkout. A visitor browsing an unavailable product may value a back-in-stock alert, while someone still considering a purchase could save a cart and return later.
Email capture can also work without an automatic coupon. Offer something useful in exchange, such as a product-selection guide or care advice relevant to the category. A generic discount pop-up may interrupt a shopper who only wanted information, and repeated discounts can train customers to wait for a lower price.
A conversion isn’t always an immediate order. For a low-intent visit, a useful next step can build a path to a future purchase without forcing a sale that the shopper isn’t ready to make.
Judge these experiences against revenue per visitor, assisted conversions, repeat purchase, and customer lifetime value alongside the immediate conversion rate. A discount that creates orders but weakens margin or customer expectations isn’t automatically a win. The best next step helps the shopper progress while protecting the value of the relationship.
Testing Changes Without Fooling Yourself
A promising idea isn’t evidence that a change works. Before editing a page, write a hypothesis that names the audience, the change, the expected behavior, and the reason. For example, if mobile shoppers struggle with a product selector, hypothesize that making available sizes clearer will improve revenue per visitor among visitors to those product pages.
Set the test up before launch
Choose one primary success metric, usually revenue per visitor for a revenue-focused test. Add guardrails for average order value, refund rate, payment failures, and customer-support contacts, so a gain in one measure doesn’t conceal damage elsewhere.
Estimate the required sample size before starting, using an appropriate testing method and the store’s baseline data. Keep the planned end date and decision criteria written down. A test needs enough observations to distinguish a dependable effect from ordinary variation, and its results can differ by device or market.
Run the test through full weekly cycles rather than stopping after an early lift. A few strong days may reflect traffic mix or normal fluctuation. Check segments only when the test plan allows for them, then confirm that a result for mobile shoppers, for example, doesn’t conceal a worse outcome for another important group.
Keep a decision log
Use a simple record for each experiment:
| Test log field | What to record |
|---|---|
| Hypothesis | Audience, change, expected outcome, and reasoning |
| Dates | Planned and actual test period |
| Traffic | Eligible visitors and variant allocation |
| Result | Primary metric and guardrails |
| Decision | Keep, revise, reject, or investigate further |
Don’t repeatedly peek at results and ship a variant because it looks good early. Decide using the planned stopping rule and the full set of relevant metrics. If the test is inconclusive, record that plainly; it may mean the change had little effect, or that the experiment needs a better design.
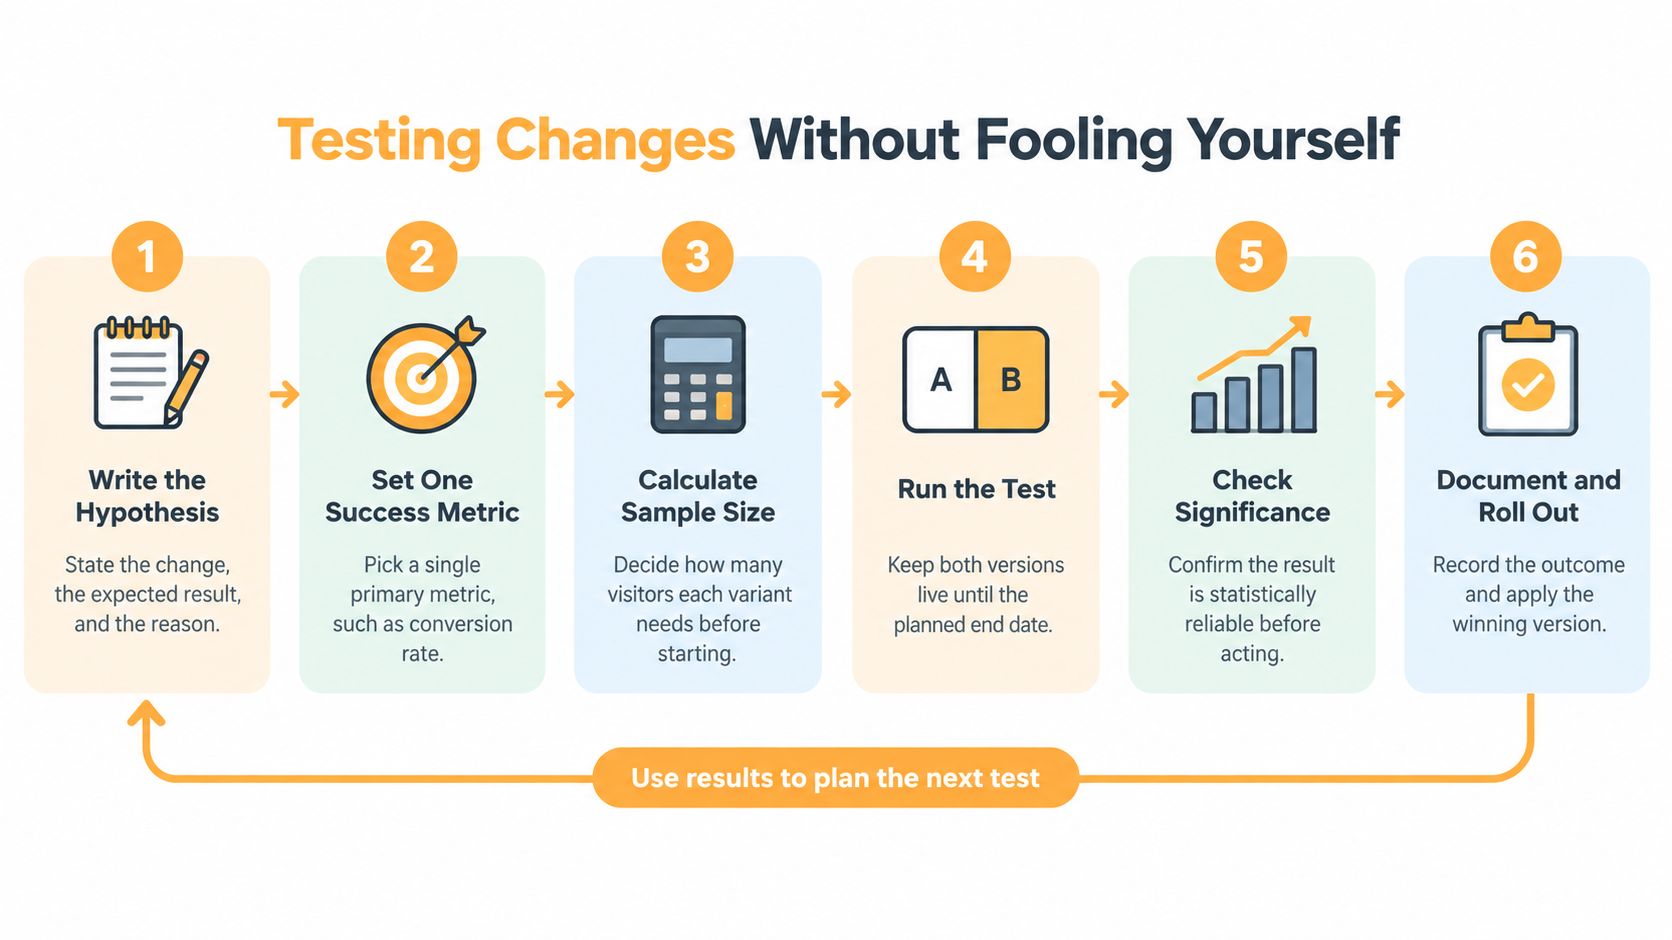
A landing-page split-testing process can help teams keep hypotheses, variants, and outcomes organized. The larger benefit comes from retaining what each test taught you. A well-documented failure can prevent the team from repeating an unsupported idea.
Choosing Between Your Team and an Agency Partner
The right operating model depends on the store’s capacity, not on whether one option sounds more advanced. Score each approach against traffic volume, developer availability, experiment pace, and analytics maturity. If the store can’t reliably measure purchases or revenue by source, improve tracking before investing heavily in experimentation.
| Approach | Best when | Main risk |
|---|---|---|
| In-house team | Store staff can analyze performance, make changes, and coordinate development | Competing priorities can leave experiments unfinished |
| Tools and apps | The problem is narrow, and the team can maintain the setup | Adding tools can create fragmented data or app overhead |
| Specialist partner | The store needs combined analytics, design, development, and testing support | A partner can’t compensate for unclear goals or weak access to data |
An in-house team has the closest knowledge of products, customer questions, and operational constraints. It can be effective when someone owns the backlog and developers can deliver changes. The trade-off is that CRO work competes with everyday launches and maintenance.
Tools and plugins can help with focused tasks, such as testing a page layout or reviewing shopper behavior. They don’t automatically identify the right problem, connect results to profit, or keep tracking consistent. More software can add complexity if no one owns how the tools work together.
Choose based on the work you need done
A partner may make sense when the store needs coordinated research, analytics, implementation, and experimentation. Excellorix offers ecommerce CRO audits, A/B testing, analytics and tracking architecture, Shopify builds with checkout optimization, and dashboards aligned with CAC, LTV, and ROAS. Its delivery process moves through Discovery, Design and Build, Launch and Optimize, and Scale and Support.
Baymard recommends removing blockers that affect all shoppers before running segmented A/B tests by device and market. That’s a useful operating principle whichever model you choose: fix clear, broadly damaging friction first, then test targeted changes with a defined audience and success metric.
Over the next two weeks, map the funnel, segment the largest drop-offs, and pick the single highest-priority leak to investigate. Bring the finding, its supporting data, and the metric you’d use to judge a fix to an ecommerce conversion audit. Then decide whether your team has the capacity to address it in-house or would benefit from an outside partner.
Excellorix works with ecommerce brands on conversion audits, testing, analytics, product-page improvements, and checkout optimization. If you’ve identified a funnel leak and want help deciding what to fix first, visit Excellorix to discuss a practical plan tied to revenue per visitor.