 Skip to content


Only about 0.2% of all websites use A/B testing tools or run experiments, while adoption reaches 32% among the top 10,000 highest-traffic sites and 20.95% among the top 100,000, according to Convert’s 2026 A/B testing statistics summary. Landing page split testing isn’t a default marketing habit yet. It’s still concentrated among operators with enough traffic, measurement discipline, and organizational patience to learn from repeated experiments.
That matters because the popular version of testing is misleading. Most experiments don’t produce a dramatic winner. The teams that create durable gains usually run smaller, cleaner tests, connect results to acquisition economics, and treat each experiment as one input into the next decision.
Table of Contents
- Why Landing Page Split Testing Still Matters
- Building a Testable Hypothesis That Drives Revenue
- How to Size Your Test and Set Significance Correctly
- What to Test on Your Landing Page First
- Implementing Your Split Test Without Breaking Data
- Reading Results and Turning Wins Into Growth
Why Landing Page Split Testing Still Matters
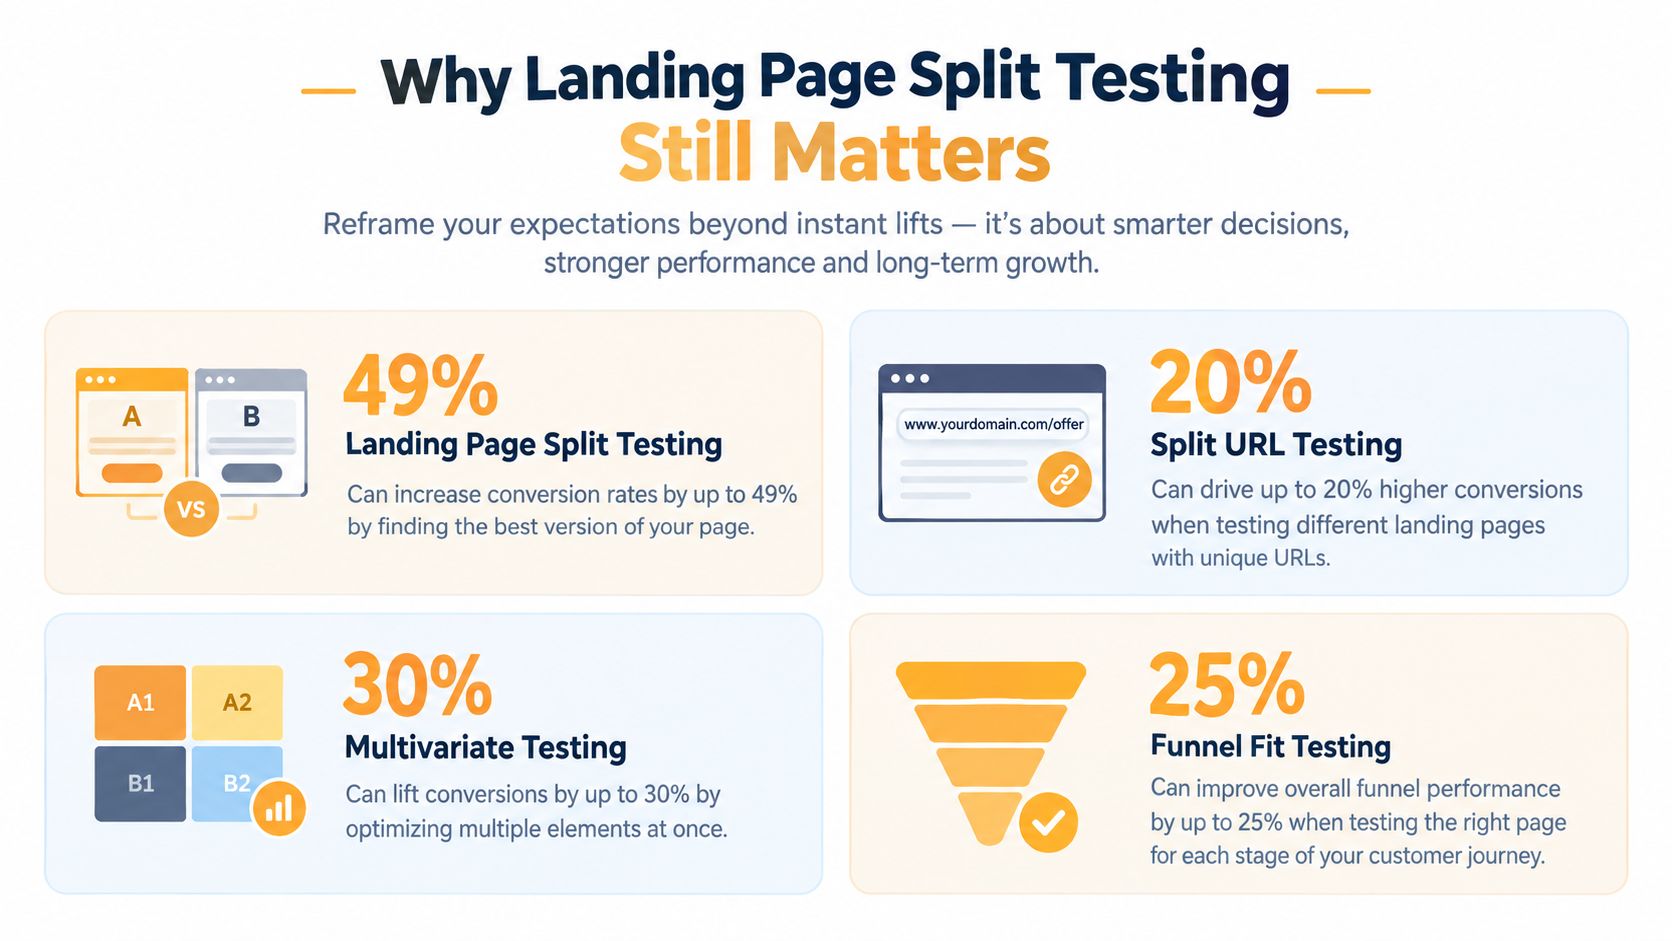
Landing page split testing is a controlled way to accumulate small, reliable gains. An A/B test keeps the control live while a variation changes one defined element or experience. A split URL test routes visitors to different URLs, making it a better fit for substantially different layouts, messaging systems, or technical builds. Multivariate testing changes several elements in combinations, but it requires more traffic and makes results harder to interpret.
Choose the method based on the decision you need to make. To test whether a shorter form reduces friction, use an A/B test that isolates the form change. To compare two page architectures, a split URL test may be more practical. If the page already performs consistently and traffic is abundant, multivariate testing can examine interactions between elements. These methods answer different questions.
The evidence favors patience over spectacle
Test results are usually less dramatic than launch announcements imply. One 2026 benchmark of A/B testing outcomes reports that 36.3% of tests produce a statistically significant winner at 95% confidence, while 41.6% are inconclusive. The median conversion-rate uplift among winning tests is 1.88%. A separate summary of more than 28,000 landing-page tests reports 13% statistically significant wins, 9% significant losses, and 78% inconclusive results, as documented in that benchmark.
The lesson is operational. A reliable program collects modest improvements, rejects weak ideas quickly, and carries useful learning into the next test instead of waiting for one redesign to repair acquisition economics.
Practical rule: A test is valuable when it improves performance or reduces uncertainty about an important customer decision.
Low traffic changes the decision entirely. If the page cannot produce enough observations to distinguish signal from normal variation, testing every button or headline creates false confidence. Fix obvious tracking and message problems first, then build qualified traffic. Test only when the expected learning justifies the time and risk.
Where testing belongs in the growth system
A landing page is one step in a longer customer path. Paid media determines who arrives, search content shapes intent, the page carries the promise, and sales or checkout captures value. A higher form-completion rate can still weaken the business if lead quality falls. A DTC page can increase add-to-carts while reducing completed purchases when the offer, price, or checkout remains unclear.
The same continuity matters for AI-referred traffic. Visitors arriving from an AI answer may bring different context and expectations than visitors from an ad or search result. Preserve the core promise from the referring answer through the landing page, then measure downstream quality rather than treating the referral as another undifferentiated source.
That is why the page belongs inside a workflow such as Excellorix’s Launch & Optimize process, where campaign execution, analytics, creative, and conversion improvements inform one another. The broader principle appears in why post-click experience affects every marketing campaign.
Define the business outcome, identify a customer friction point, test one meaningful change, and preserve the learning whether the result wins, loses, or remains inconclusive. Tie the primary outcome to CAC, qualified pipeline, revenue per visitor, or ROAS, not only to a convenient page metric.
Building a Testable Hypothesis That Drives Revenue
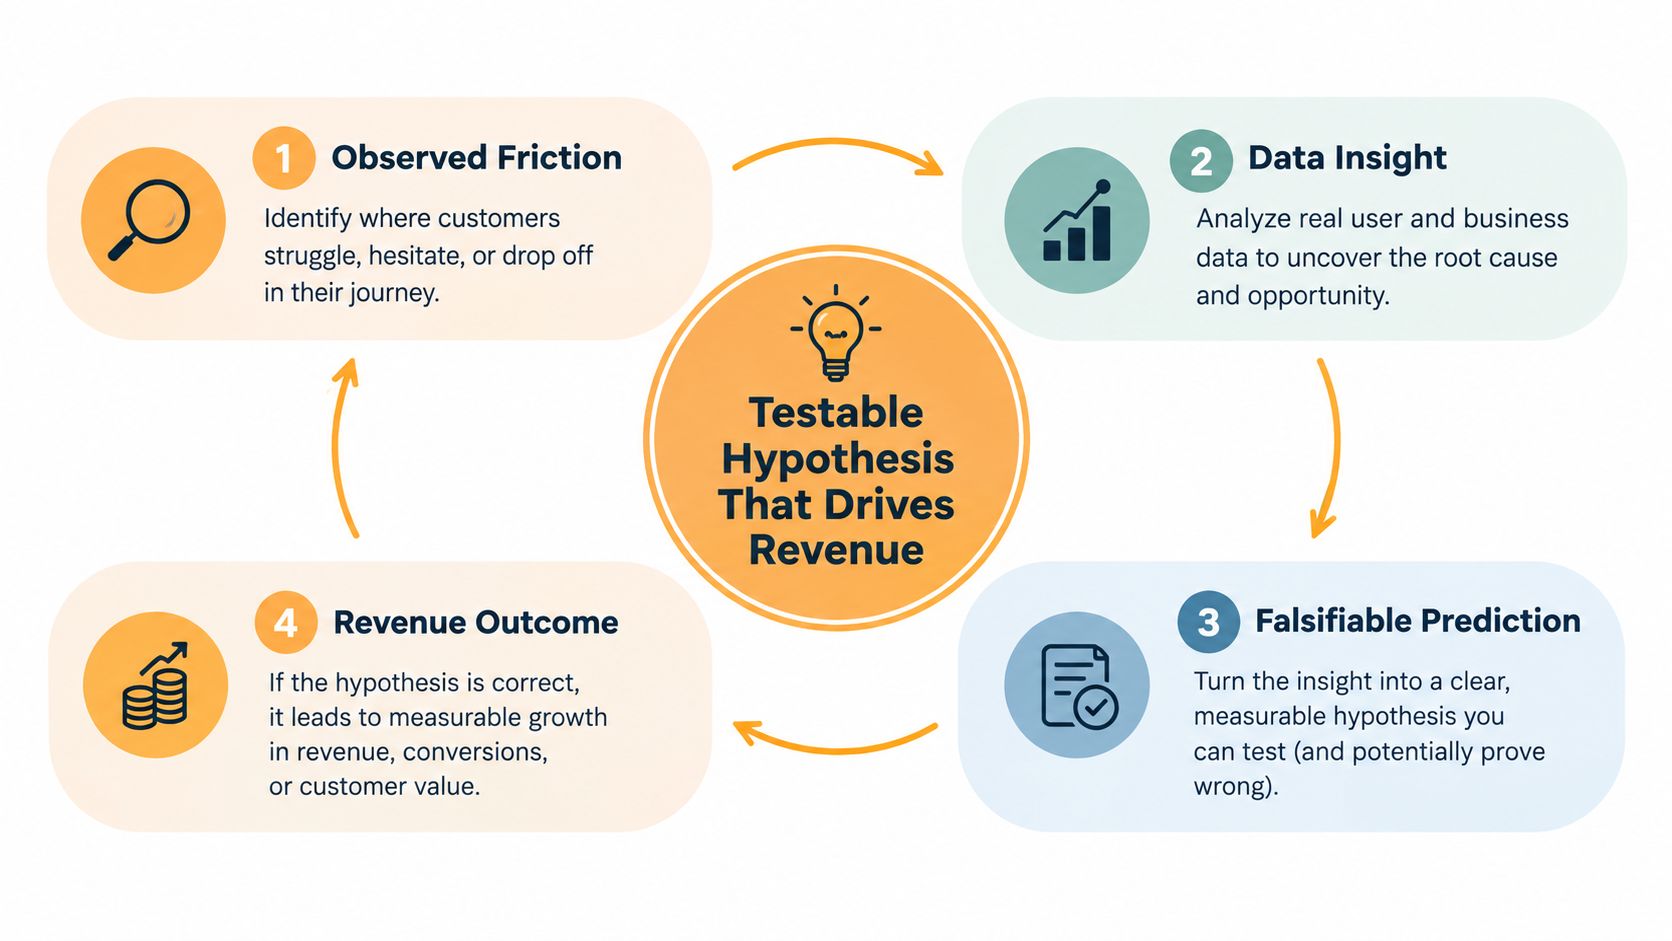
A test idea becomes useful only when someone could prove it wrong. “Improve the hero section” isn’t a hypothesis. “Make the CTA stand out” isn’t one either. Both describe activity without stating the customer problem, the audience, or the expected business effect.
Use this structure:
If we change X for audience Y, we expect Z because [observed reason].
For example, a B2B team might write: If we replace the generic headline with language that reflects the operational problem mentioned in sales calls, we expect more qualified demo requests because prospects currently need to interpret the product’s relevance for themselves. A Shopify brand could test whether showing the primary product benefit before technical specifications improves add-to-cart behavior for paid social visitors because those visitors arrive with limited product context.
Start with evidence, not taste
Pull observations from several sources before drafting variants:
- Analytics: Find landing-page exits, form-start abandonment, device differences, and traffic-source behavior.
- Behavior tools: Use click maps, scroll maps, and session recordings to identify ignored elements or confusing interactions.
- Customer language: Review sales-call notes, support tickets, product reviews, survey responses, and search queries.
- Acquisition context: Compare the promise in the ad, search result, email, or AI answer with the message visitors encounter on the page.
The last point deserves more attention. Adobe’s guidance on A/B testing for AI-referred visitors says teams need to test context, continuity, and alignment with the conversation that brought a visitor to the page. An AI-referred visitor may arrive after receiving a concise recommendation, comparison, or explanation. A page that begins with a broad brand statement can feel disconnected even if its design is polished.
That creates different hypotheses from traditional button testing. Test whether the page preserves the upstream answer’s intent, terminology, and promise. Test whether it confirms the visitor’s likely question immediately. Test whether the next action feels like a natural continuation of the conversation rather than a reset.
Select one primary outcome
A test can monitor several supporting signals, but it needs one declared primary metric. For a lead-generation page, that might be completed qualified forms rather than raw submissions. For ecommerce, it could be completed purchases or contribution margin per visitor. For a healthcare consultation page, it might be booked appointments, provided the booking event is tracked reliably.
Secondary metrics help diagnose behavior. Form starts can reveal friction before submission. Scroll depth can show whether visitors reach proof. Revenue per visitor can expose a trade-off that a top-of-funnel conversion metric hides. They shouldn’t become a menu from which the team selects the most favorable result after launch.
Prioritize the backlog by business value, strength of evidence, reach, and implementation effort. A headline seen by nearly every visitor usually deserves attention before a lower-page icon. A checkout-impacting offer question may outrank a cosmetic layout change. A result that only improves an unqualified micro-conversion shouldn’t outrank a smaller but more valuable lead-quality opportunity.
The CRO services approach to finding revenue leaks is useful here because it treats the page as part of a wider path, not an isolated creative surface.
How to Size Your Test and Set Significance Correctly
Sample size determines whether a landing-page experiment can detect a commercially meaningful improvement. Set it before launch, rather than adjusting the target after the first results appear.
Base the estimate on four inputs:
- Baseline conversion rate, the current rate for the control.
- Minimum detectable effect, the smallest relative improvement worth acting on.
- Confidence level, the tolerance for declaring a random difference a winner.
- Statistical power, the likelihood of detecting a real effect when one exists.
A commonly used setup combines 95% confidence and 80% power. With a 3% baseline conversion rate, detecting a 20% relative improvement requires roughly 3,800 visitors per variation. With a 1.5% purchase-page conversion rate, the requirement rises to about 7,700 visitors per variation, according to the sample-size calculator guidance from TextKit.
Low conversion rates require more patience because random variation can obscure a real difference. The relevant unit is completed conversions, not visitors alone.
Convert volume into a realistic schedule
At 1,000 visitors per day, those examples need roughly 8 to 16 days to reach minimum volume. That is only the initial estimate. Paid traffic can spike, weekends can behave differently from weekdays, and a creative refresh can change the audience mix.
Run the experiment through at least one complete business cycle. If the calculated sample arrives early, keep the planned end date unless an implementation problem makes the result unreliable. Variable traffic calls for more buffer, not a shorter test window.
| Baseline Conversion Rate | Visitors Per Variation | Days at 1000 Visitors Per Day |
|---|---|---|
| 3% | Roughly 3,800 | Roughly 8 days |
| 1.5% | Roughly 7,700 | Roughly 16 days |
The figures illustrate the relationship between baseline rate, detectable effect, and required traffic. They do not create a universal schedule. Set the actual plan around the baseline, effect size, allocation, audience stability, and primary conversion event. The sample-size calculator guidance above provides the underlying estimates.
Know when not to test
Thin traffic changes the decision. If a page cannot generate enough stable observations to detect a commercially meaningful improvement, a formal split test may produce noise rather than useful evidence. This occurs often with specialized B2B pages, healthcare services, industrial products, and small campaigns.
Use qualitative and diagnostic evidence first. Speak with prospects, review recordings, inspect form errors, compare ad-to-page message continuity, and correct obvious friction. The next improvement may involve the offer, targeting, creative, or funnel structure instead of a page variant.
AI-referred traffic adds another continuity check. Confirm that visitors arriving through AI-generated recommendations receive the same promise, tracking treatment, and variant assignment as visitors from other channels. If that traffic is small or its source classification is unstable, treat it as a monitoring question rather than forcing a separate test.
A 2026 guide to landing-page testing constraints notes that novelty effects can fade after 7 to 10 days. An early lift may reflect attention to a new experience instead of a durable preference. Define the sample, duration, confidence, power, primary metric, and stopping rule before reviewing results.
What to Test on Your Landing Page First
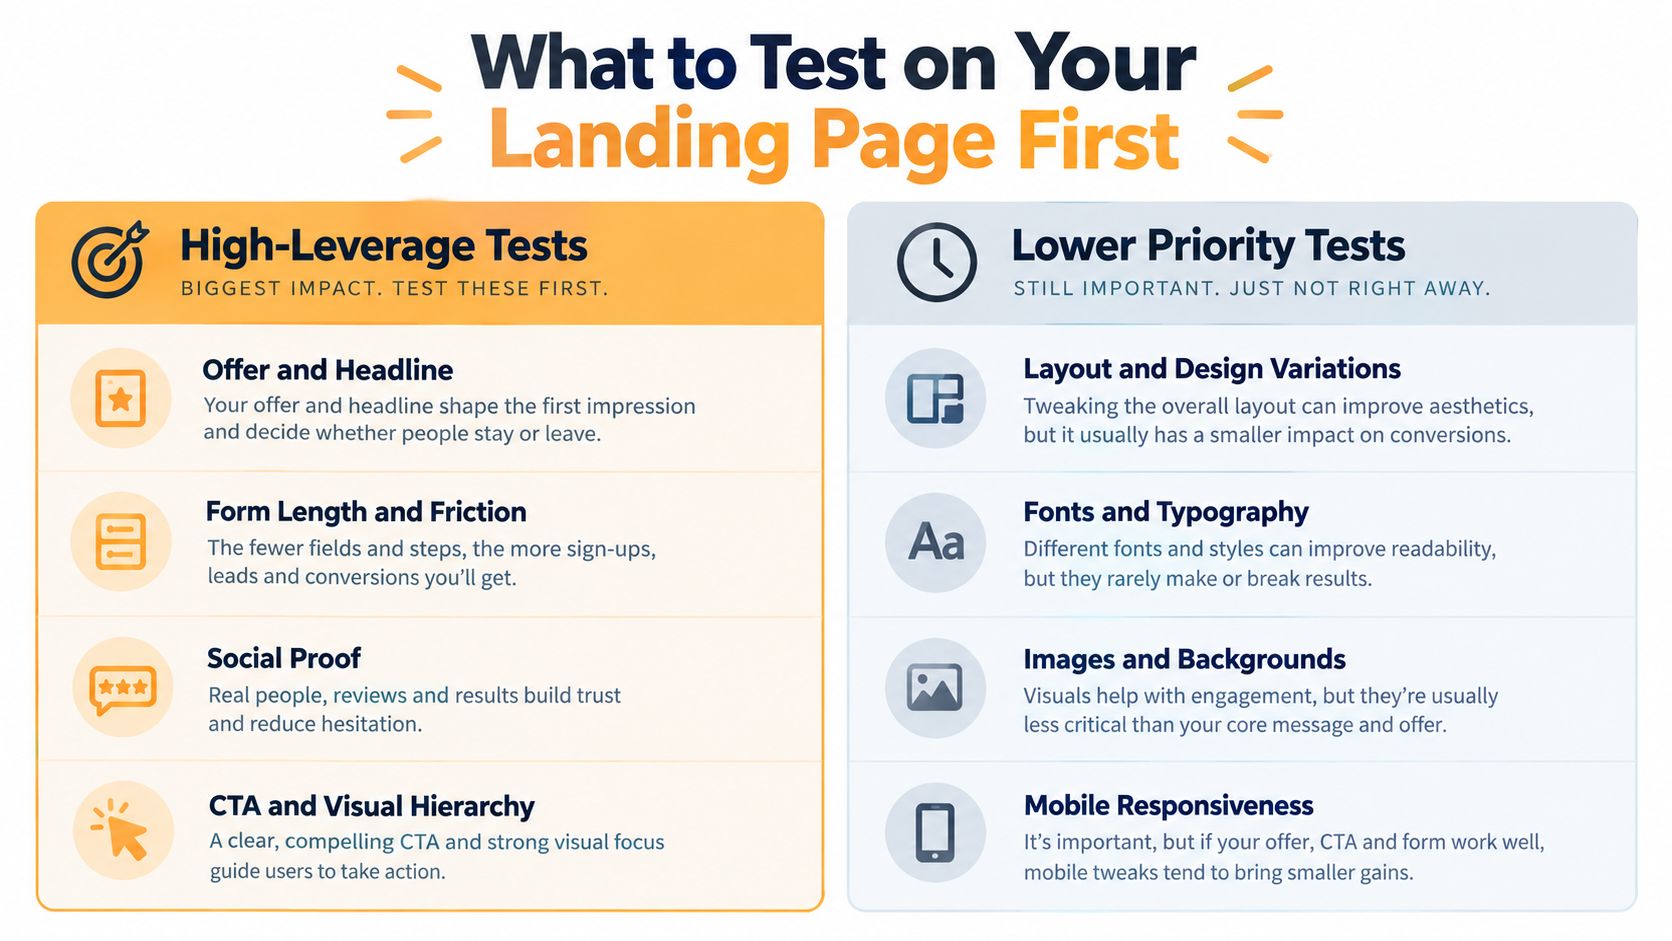
The best first test usually addresses a high-value decision that visitors must make. It isn’t necessarily the easiest element to edit.
Offer and headline
The offer answers, “What do I get, and why should I act?” The headline frames that answer before the visitor has invested attention. Test a sharper promise against the existing message, but preserve the audience and intent you’re targeting.
For a paid-search B2B page, a headline that mirrors the problem in the ad may reduce interpretation effort. For a Shopify product page, the stronger test may involve the benefit, bundle, guarantee, or delivery promise rather than a different adjective. For a healthcare consultation page, clarity, expectations, and credibility can matter more than urgency.
Avoid testing a headline in isolation if the surrounding subhead, proof, and CTA contradict it. One changed variable means one causal question, not one tiny edit regardless of context.
Forms and friction
Form testing has a direct trade-off. Fewer fields can increase completion, but qualification may decline. More fields can help sales teams prioritize, but they can also ask for information before the visitor trusts the business.
A B2B team should compare the value of additional qualification with the cost of lost submissions. A healthcare page may need to protect privacy expectations and explain what happens after submission. A DTC page often has no lead form, so the equivalent friction may be variant selection, shipping information, or uncertainty about returns.
Proof, pricing, and hierarchy
Social proof works only when visitors notice it and understand why it applies to them. Compare customer evidence near the relevant claim, a compact proof block above the main action, or more detailed evidence lower on the page. Don’t add unsupported testimonials or vague trust language. Use proof your organization can substantiate.
Pricing presentation deserves a separate hypothesis. Compare how the offer is structured, what is included, and whether the next step is clear. Don’t bundle pricing, headline, page design, and CTA changes into one “new page” test if you need to know what caused the outcome.
A test should answer a business question, not merely produce a different-looking page.
A practical priority matrix
| Situation | Start with | Avoid starting with |
|---|---|---|
| High-intent paid traffic | Offer, message match, or form friction | Decorative color changes |
| Organic comparison traffic | Headline clarity, proof, and decision support | A major visual redesign without a clear question |
| B2B lead generation | Qualification trade-offs and sales objections | Optimizing only for raw form volume |
| DTC product traffic | Benefit hierarchy, offer, and purchase friction | Isolated microcopy with no behavioral rationale |
| Healthcare consultation traffic | Trust, expectations, and next-step clarity | Aggressive urgency that weakens confidence |
The landing-page guidance on reducing CAC and increasing ROI supports the same operating principle: prioritize changes that affect the economics of the acquisition path.
Implementing Your Split Test Without Breaking Data
A sound hypothesis can still produce unusable results if the implementation changes who sees the page, loses conversions, or loads the wrong variant.
Choose the architecture
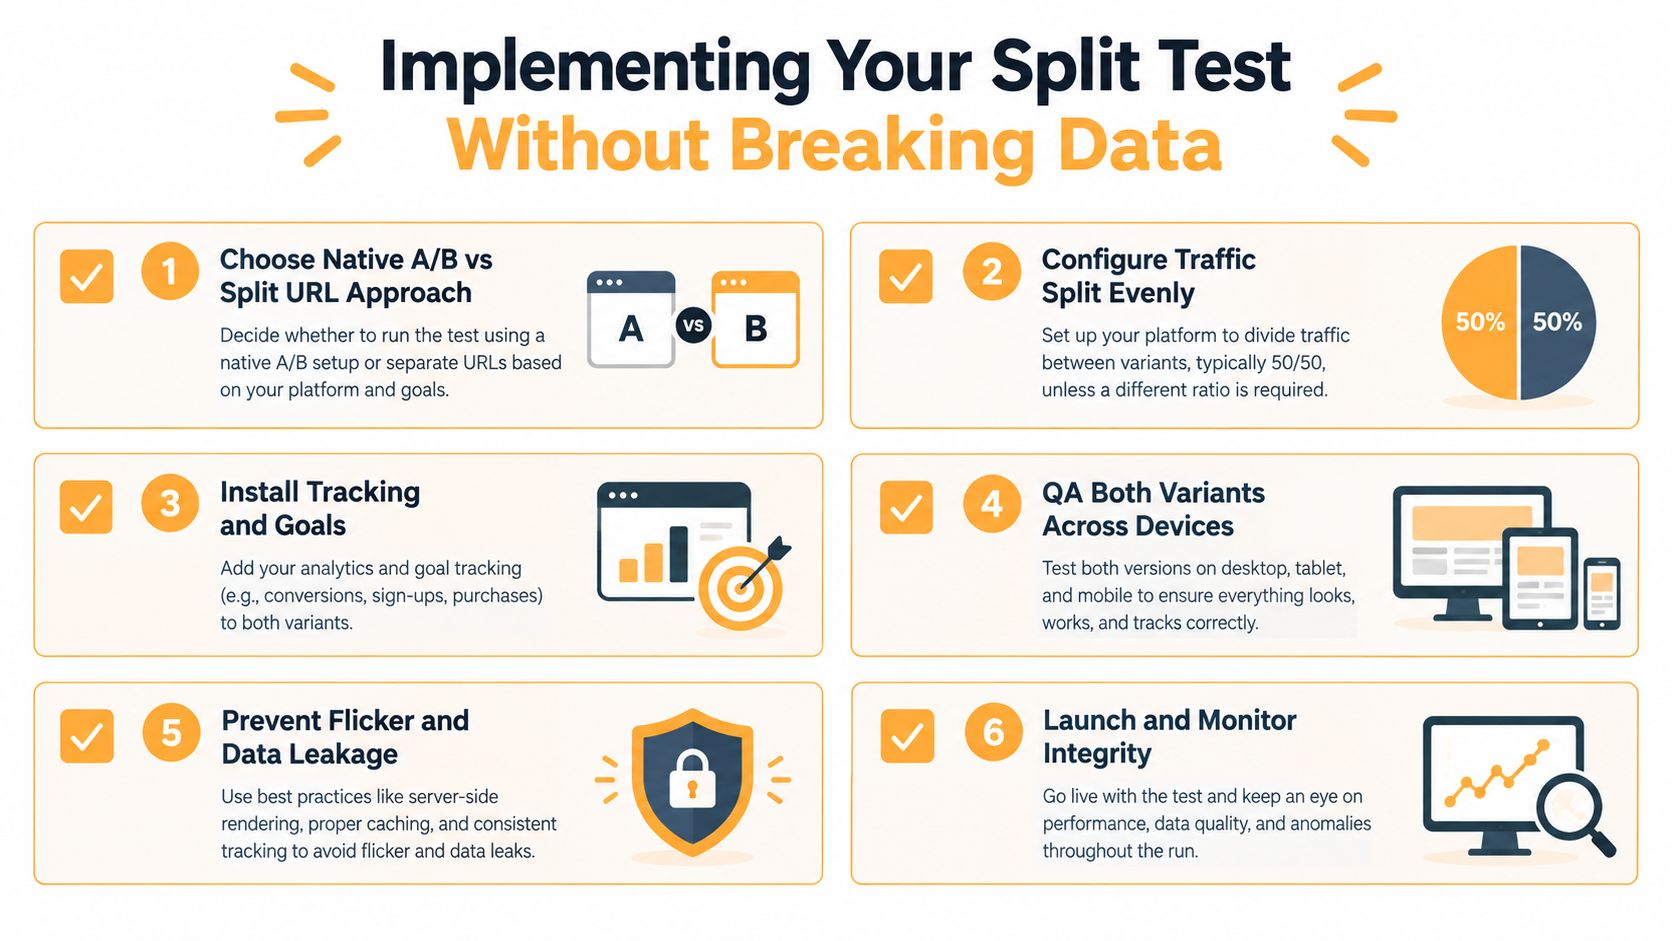
Use native A/B testing when the control and variation share the same URL and differ in a defined experience. Use split URLs when the variants require different templates, routing, or page systems. The second approach can be powerful for large changes, but it introduces more opportunities for tracking, redirect, indexing, and page-speed inconsistencies.
Whichever architecture you choose, write down the audience rules. Exclude internal traffic where appropriate, decide how returning visitors are assigned, and make sure the same user doesn’t receive a different version during a meaningful journey.
Verify the data path
Before launch, test both variants from the first page view through the primary conversion. Confirm that analytics records the correct experiment assignment, form systems receive submissions, ecommerce events carry revenue, and CRM records preserve source and variant information.
Run the checks on mobile and desktop, across major browsers, and with common privacy or consent states. A broken variation can look like a losing variation. A missing purchase event can make the control appear superior for reasons unrelated to customer behavior.
Protect the experiment during launch
Use an even traffic split unless your risk plan requires another allocation. Avoid simultaneous changes to ads, landing-page targeting, pricing, or checkout during the test. A new campaign can change the audience mix and make the page result impossible to interpret.
Watch technical integrity, not the outcome. You can confirm that traffic is arriving, variants are rendering, and conversions are being recorded. Don’t repeatedly inspect the winner and stop when the chart looks favorable. Guidance on sample-size pitfalls and early stopping identifies premature termination, repeated checking, and multiple-variable changes as common sources of false positives.
For low or spiky traffic, require a full business cycle and account for novelty effects. A launch checklist should include:
- Assignment: Confirm the intended audience reaches both variants.
- Tracking: Validate the primary event and revenue or lead-quality fields.
- Rendering: Check content, forms, links, scripts, and responsive behavior.
- Speed: Compare loading and interaction behavior between variants.
- Contamination: Freeze unrelated campaign and page changes.
- Stopping rule: Record the planned sample and end date before launch.
Reading Results and Turning Wins Into Growth
A winner is the variation that satisfies the predeclared decision rule, passes data-quality checks, and improves the business outcome. A higher displayed conversion rate alone does not qualify.
Begin with the primary metric, then examine results by device, traffic source, audience intent, and downstream quality. A lead page can generate more form submissions while producing fewer sales-accepted leads. A product page can increase add-to-cart activity without raising completed orders. Those patterns may still reveal where the hypothesis worked and where it failed.
Check continuity across traffic sources, including visitors referred by AI tools. If AI-referred sessions convert differently, track that segment separately and confirm that referral data, landing-page assignment, and downstream events persist. A short-term page win is less useful if the experience breaks for a growing acquisition source.
An inconclusive test remains useful when its design was sound. The change may have been too small to detect, the hypothesis may have targeted the wrong friction, or the audience may need a different intervention. Record the hypothesis, audience, variants, sample plan, outcome, data-quality notes, and next question. Do not turn an inconclusive result into an unmeasured redesign.
Make learning operational
Move a validated winner into the control only after confirming tracking and downstream behavior. Archive the losing version with its screenshots, copy, targeting, test dates, and analysis. That record prevents future teams from repeating the same question.
Apply useful findings across the business:
- Paid media can reuse message language that improved response.
- SEO teams can align headings with validated search intent.
- Email teams can address objections and repeat benefits that helped visitors act.
- Sales teams can use stronger proof in customer conversations.
- Product and merchandising teams can apply offer insights beyond one page.
A sustainable cadence is a prioritized backlog, clear statistical governance, and a next question tied to the previous result. Reliable iteration compounds through small gains rather than occasional redesign bets, as the 2026 landing-page testing guidance on reliable iteration explains.
Do not test a page because the testing tool is available. If traffic is low or unstable, improve the page using customer evidence, wait for a stable business cycle, or test a larger change with a clearly defined decision rule.
Start with one revenue-critical page. Document its baseline, customer friction, and falsifiable hypothesis, then confirm that traffic is sufficient and stable. Excellorix supports landing page design, experiment setup, analytics implementation, and ongoing optimization through its growth marketing services. Visit Excellorix to discuss a program tied to qualified leads, purchases, CAC, and ROAS rather than vanity metrics.


